les Nouvelles February 2020 Article of the Month
Immuno-Oncology Alliances Command Big Deal Premiums
Bioscience Advisors, Inc.,
Managing Director,
Walnut Creek, CA, USA
Everyone knows that immune-oncology (IO) is the hottest ticket in biopharma alliances. With almost 100 announced deals involving PD-1, and more than half as many with PD-L1, it seems that everyone is jumping onto the IO dancefloor. However, as with all things alliance-related, the devil is in the details. What IO molecular target(s) should one bring to the dance? CD20, HER1 or HER2, TNF-alpha, CTLA4… and the list goes on. And when is the optimal time to seek and strike a deal: preclinical data, Phase I safety data, Phase II clinical proof of concept, or Phase III pivotal trials as a monotherapy? In other words, with such a crowded dancefloor, when is the best time to join the IO dance?
Introducing MoA Classification of Biopharma Alliances.
Over the past decade it has become increasingly common for the scope of a biopharma alliance to be defined by mechanism of action (MoA). The clinical success of monoclonal, antisense and, lately, RNAi and gene therapy approaches to drug development is partly responsible for this trend. However, even small molecule collaborations and formulation deals for life cycle management have recently turned to MoA descriptors to define and limit the boundaries of an alliance.
BioSci analysts have worked diligently to capture this new axis of deal analysis. For example, last week we tagged the 1,000th SEC-filed biopharma contract that defined the scope of the alliance by MoA. Now, with the publication of this article, we are introducing a new alliance keyword search capability to BiosciDB. com: the ability to select alliances on the basis of 30+ MoA Categories (e.g. Enyzme Inhibitor, Kinase, Immuno- Oncology), 17 Drug Modes of Action (e.g. Activator, Agonist, Antagonist) and 776 Molecular Targets (e.g. MEK, PKC, PARP-2). To complete this enhanced functionality, we have coded approximately 2,600 biopharma alliances on the basis of the principal alliance Compound (1330 discrete compounds to date), including all known synonyms for that compound. This means an analyst can search by MoA to find deal-specific compounds, or by compound to identify MoA.
As the maiden voyage of this new capability, we have chosen to take a close look at IO alliances. Which molecular targets are the hottest of the hot? How do deal terms for IO targets compare to Non- IO cancer compound alliances? When is the optimal time to partner an IO target-based alliance?
Methodology
For purposes of this analysis, we looked at approximately 400 alliances involving one or more IO molecular targets. Of these, 180 were research or supply agreements that didn't convey commercial licenses, leaving 225 IO alliances having a license component (IO Alliances). Similarly, we looked at approximately 600 alliances involving one or more oncology compound of any type or classification other than immuno- oncology. Again setting aside research or supply only agreements that did not convey commercial licenses, we obtained 460 Non-IO cancer compound alliances having a license component (Non-IO Alliances).
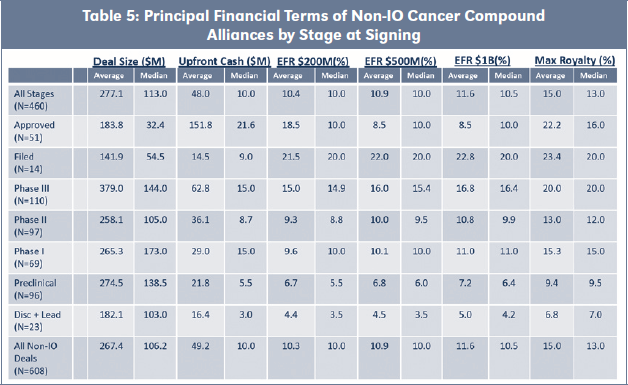
For each of the IO Alliances and Non-IO Alliances, we analyzed the financial terms to the extent publicly available, and we have summarized the average and median values, by stage at signing, for the principal financial terms. The detailed spreadsheets for the IO Alliances, see Table 4 and for the Non-IO Alliances, see Table 2.
Our definitions of the principal financial terms in this analysis are as follows:
- Deal Size—a summation of all upfront, R&D and milestone payments, including any equity or loan amounts, to be paid to the licensor;
- Upfront Cash—the license fee plus any annual payments within five years from signing that are not based on events (i.e. not milestones);
- EFR $200M—the Effective Royalty Rate (EFR) owed by licensee to licensor in the event that annual net sales reach $200M;
- EFR $500M—the Effective Royalty Rate (EFR) owed by licensee to licensor in the event that annual net sales reach $500M;
- EFR $1B—the Effective Royalty Rate (EFR) owed by licensee to licensor in the event that annual net sales reach $1 Billion; and
- Maximum Royalty—the highest royalty tier owed by licensee to licensor, not counting any profit split or supply payment.
For each of the principal financial terms, only the non-zero values are included in the average and median calculations in the tables and spreadsheet summaries. For example, of the 49 IO Alliances signed at preclinical stage of development, we know the Deal Size for 33, the Upfront Cash for 29 and the Maximum Royalty rate for six alliances.
Finally, as with most BioSci analyses, the tags to specific MoA provisions within the Scope of Agreement for many of the IO Alliances and Non-IO Alliances are accessible directly via the "Tag" links in the embedded spreadsheets. Subscribers to BiosciDB may also access the full biopharma alliance from which each tagged provision was extracted by following the "Deal" link. Backup data for the tables can be found on the following link: https://www.lesi.org/les-nouvelles/edwards-article-charts.
Deal Size of IO Alliances vs. Non-IO Alliances
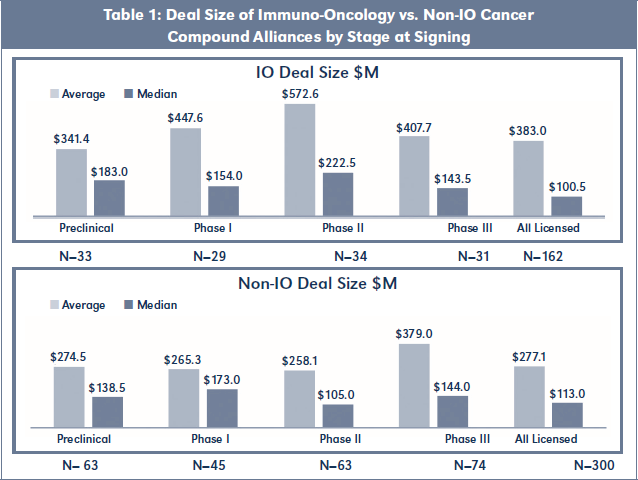
The 225 commercialization alliances involving IO molecular targets had a median Deal Size of $100M and average Deal Size of $383M. Similarly, the 460 commercialization alliances involving Non-IO cancer compounds had a median Deal Size of $113M and average Deal Size of $278M. When the two cohorts were sorted by stage at time of signing, however, significant differences in financial terms emerged. As shown in Table 1, Phase II stage IO Alliances had double the Deal Size of Non-IO Alliances on both an average and median basis. Preclinical stage I0 Alliances obtained a 25 percent plus premium over Non-IO Alliances on both an average and median basis. Phase I stage IO Alliances had a 70 percent premium over Non-IO Alliances on an average basis, but were 11 percent lower on a median basis. Only Phase III stage alliances showed rough parity in Deal Size between IO Alliances and
Non-IO Alliances.
Upfront Cash of IO Alliances vs. Non-IO Alliances
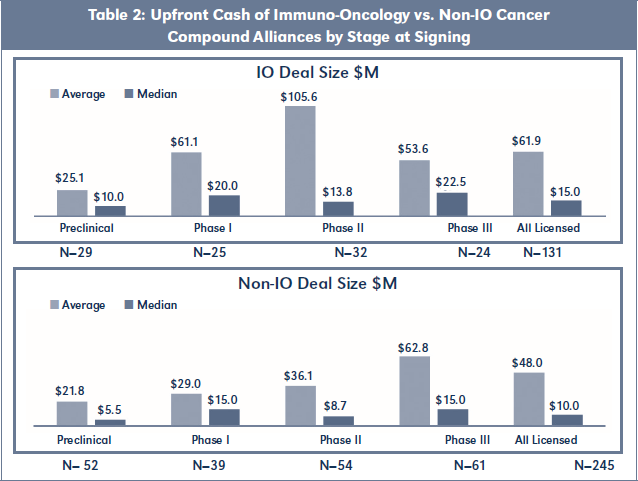
With respect to Upfront Cash at signing, Table 2 shows that IO Alliances obtained higher payments across all stages of development on both an average and median basis. IO Alliances signed at Phase II again registered the largest difference, with Upfront Cash averaging almost triple the amount for IO Alliances
versus Non-IO Alliances.
Maximum and Effective Royalty Rates of IO Alliances vs. Non-IO Alliances
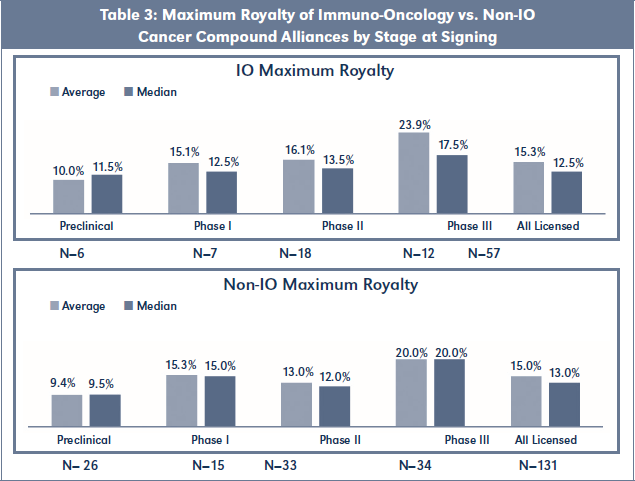
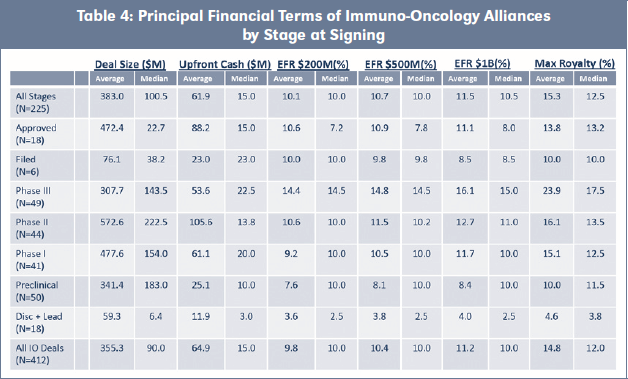
Table 3 shows that Maximum Royalty rates were similar for both cohorts, with the exception of Phase II stage IO Alliances, which obtained a 24 percent premium over Non-IO Alliances on an average basis (12.5 percent median premium). Table 4 summarizes all principal financial terms for IO Alliances, including Effective Royalty Rates (EFR) for assumed annual sales of $200M, $500M and $1B. Table 5 has equivalent summaries of all principal financial terms for Non-IO Alliances.
Top 12 Molecular Targets of IO Alliances
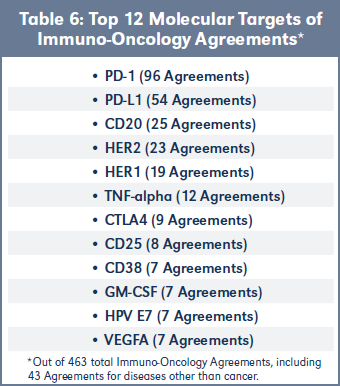
Table 6 identifies the 12 most frequent molecular targets of all 463 agreements in BiosciDB.com directed to immuno-oncology targets. Unsurprisingly, PD-1 and PL-L1 are the most common IO targets, followed by CD20, HER2, HER1 and TNF-alpha for the top six slots. The remaining six are roughly in parity with each other. The spreadsheet of molecular targets for all 463
immuno-oncology agreements is available, see Table 3.
Conclusions
This analysis has shown that IO Alliances command a substantial deal premium over Non-IO cancer compound alliances at several stages of development. This premium is highest for IO Alliances commenced at Phase II and appears to be reflected in both upfront and royalty payments. Finally, as PD-1-and PD-L1-based compounds have achieved commercial success, there has been a proliferation of immuno-oncology targets that have added to the breadth of IO Alliances and contributed to this becoming the dominant biopharma deal sector. ■
Available at Social Science Research Network (SSRN):
https://ssrn.com/abstract=3317049.
