 Christopher K. Larus
Partner and Chair of the National IP and Technology Litigation Group
Robins Kaplan LLPMinneapolis
Minneapolis, MN, USA New York, NY, USA
 Miles A. Finn
Counsel
Robins Kaplan LLP
New York, NY, USA
 Congnan Zhan, Ph.D.
Senior Economic Consultant and Data Scientist
Robins Kaplan LLP
Minneapolis, MN, USA
 Joseph (Yu) Chen, Ph.D.
Science Advisor and Technical Consultant Manager
Robins Kaplan LLP
Minneapolis, MN, USA
 Shelley R. Gilliss, Ph.D.
Chief Talent Officer and Chief Administrative Officer
Robins Kaplan LLP
Minneapolis, MN, USA
Shelley R. Gilliss, Ph.D.
Chief Talent Officer and Chief Administrative Officer
Robins Kaplan LLP
Minneapolis, MN, USANot all patents are created equal. Finding patent assets likely to drive substantial value in licensing efforts is difficult. Getting the answer right can unlock substantial value and allow innovators to optimize expected return on investment. But making a mistake can lead to a costly waste of valuable resources. In the highly dynamic environment of patent licensing and monetization, patent holders, capital investors, and potential licensees alike increasingly look for data-driven quantitative guidance in evaluating the value of a patent portfolio. A complete analysis of patent value necessarily requires detailed qualitative review of specific patent assets. This detailed qualitative review, which generally involves a detailed review of patent claims, specification, and file history may not be economically practical when assessing large portfolios. In such instances, quantitative measures of patent value can provide important tools for screening portfolios to identify those patents worthy of detailed qualitative analysis.
Meaningful quantitative analysis of patent value must assess the diversity of objective factors that determine patent value. Unfortunately, many commercially available software programs employ black-box algorithms that do not disclose the extent to which various objective factors are measured. Even those software programs that disclose the details of their patent scoring algorithms generally do not allow users to adjust patent scoring approaches to meet the demands of specific patented technologies, markets, or monetization efforts.
We designed a patent evaluation method based on statistical methods to create a single-dimensioned measure of a single patent’s value. We measured “value” through the output of district court litigation of similar patents. As discussed below, we developed a model predicting the likelihood that a patent would be selected for litigation. The inputs to this model were factors output from a commercial patent database. We chose to define patents selected for litigation as having high value, because a party that puts a patent into litigation has likely made a complex determination that the potential gain from asserting the patent offsets the litigation cost and the risk that the patent will be invalidated. Further, and separate from our regression model, we compared the effect of the claimed technology on the likelihood that a patent would be asserted in litigation. This analysis is discussed in section IV.A.
We then looked for the differences of these factors between sets comprising all patents, litigated patents, and patents proven to have high economic value in district court litigation. These sets included groups of patents that were asserted in trials and won high damages at the district court level. This analysis required us to consider pools of patents as the unit of analysis because our damages data did not permit us to ascribe particular damages to a given patent. However, this analysis, being explicitly tied to damages, is perhaps more closely tied to individual patents’ economic value than the analysis presented in section IV.A. In section IV.B we looked for statistically different values of the factors that were the input to the model, comparing awarded high damages with the patents that were not litigated. Similarly, in section IV.C we compared the values of the factors between the high-damages patents and the litigated patents. We also compared the technology claimed by the high-value patents with the technology of litigated and non-litigated patents in the regression models.
Our analysis of patents relies on data available from a commercial database (Questel’s Orbit Intelligence platform) to evaluate the relative value as determined in litigation of patents. (As discussed below, the basic unit of analysis is the patent family, not the isolated patent.) For our work on evaluating patent value with respect to surviving inter partes review, see our previously published work in les Nouvelles.1
Researchers in this field have studied ways to value or rank patents in a portfolio. Compared with the publications discussed below, our analysis is unique in that it attempts to measure patents’ economic value as that value is determined through litigation. Further, it relies on recent litigation data. In Table 1, we compare the approaches of prior studies with our work.

Three references considered the likelihood that a patent would be litigated. Campbell et al. (2016) presented a machine learning application to predict whether a patent will likely be involved in litigation.2 They based their model on patent metadata (e.g., assignee, assignee country, number of claims), a textual analysis of the claims, and citation graphs. Marco et al. (2015) studied patent- and patent examination-related characteristics on the likelihood of later patent infringement litigation.3 Factors that had a significant relationship to the likelihood of litigation included entity size, foreign origin, the number of domestic patent applications, and the claim length. Examination-related characteristics, like the GS-level of the patent’s examiner and the number of IDSs filed, had less explanatory power than did patent characteristics. Marco did not consider the number of forward citations except to match patents in a case-controlled comparison to better identify the importance of other factors. Like the present work, the 2004 work of Allison and Lemley, et al., studied the characteristics of patents in litigation and employed a logistic regression method.4 The authors associated the patent value with the presence or absence of litigation, but they did not study patents that won high damages, or even if their sample patents won any damages. In fact, none of these three papers evaluated the award of damages.
Some authors have considered economic value. For example, Hall, Jaffe, and Trajtenberg (2005) explored the usefulness of a firm’s patent portfolio’s citations as a correlate to a firm’s stock market valuation.5 However, unlike our present work, theirs reflects economic value of a portfolio, not the economic value of a given patent or patent family. Factors studied included forward citations, the number of patents a firm owned, and the firm’s R&D spending. Other papers that estimated the economic value of patents include Lanjouw and Schankerman 2001,6 and Abrams, Akcigit, and Popadak 2013.7 Our study contributes to this literature by using more recent data and proposing another scoring method that uses data from a commercial database.
We studied the differences between the following groups of U.S. utility patents:
We collected our patent data from Questel Consulting’s Orbit database.8 Orbit generates many factors associated with patent families. We used nine factors in our logit model: technology impact,9 recent non-self-citations, 10 generality,11 originality,12 shark present,13 family size,14 claim length,15 year of the first application date,16 and technology centers.17
We used multiple statistical techniques to examine the differences in observed patent factors between two groups of patents, and to ultimately evaluate the value of patents. These techniques include logistic regression, t-tests, and binomial tests.
Logistic regression, or logit modeling, is a statistical method used to predict the probability of discrete outcomes. 18 We used it to evaluate the extent to which these factors can change the odds of litigation. We used the t-test to determine statistical significance of the difference in each factor between the litigated patent families and non-litigated, the high damages and the litigated, and the high damages and the non-litigated. We used the binomial test to evaluate the statistical significance of the technology area effect.
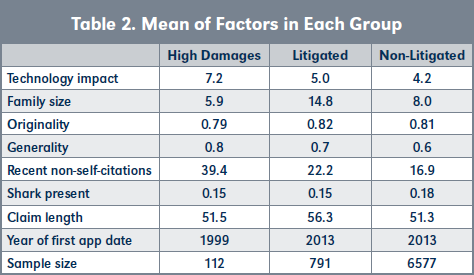
To identify litigated patents, we collected all U.S. utility patents with an application date later than January 1, 2016 that were litigated before September 1, 2021. This set constituted 791 patent families. The patent set of litigated patents were, on average, issued 2.7 ± 1.7 years before our September 1, 2021, cutoff date. Ninety percent of these patents issued less than 4.2 years before that cutoff date. To build a paired comparative set, we used Questel’s “similar patents” query and sampled 6,577 U.S. utility patent families that had not been litigated. Analysis of these two sets is found in part IV.A.
Turning to our data set for high-damages patents, we identified 112 patent families from the set of litigated patents that included patents associated with cases in which damages of more than $100 million were awarded.19 These patents included patents older than our cutoff date. The “high damages” patents were issued between 1984 and 2018, with the median- aged patent issued in 2002. Section IV.B of this paper compares the factors for these 112 high-damages patents to the factors for the 6,577 not litigated patent families. Similarly, section IV.C compares the factors of the high-damages patents with the factors of the 791 litigated patent families. The litigated set and the non-litigated set are the data used in section IV.A.
Technology area has a fixed effect on identifying the factors. For example, the litigation rate varies in technology (Larus, C. K. et al. 2018, Allison & Lemley et al. 2004, Lanjouw and Schankerman 2001.) Our previous study on patents petitioned in IPR (Larus, C. K., et al. 2018) finds that the IPR survival rates differ significantly in technology areas. Also, results in Allison & Lemley et al. 2004 also show striking variation by industry. We controlled for this fixed effect of each technology area in the regression by using dummy variables, which is a way to compare the factors and identify the significance given patents in the same technology center.
We used the USPTO’s “Technology Center” classification to place each patent studied in a group of claimed technology.20 Using this classification, for example, Technology Center 1600 includes the Biotechnology and Organic fields, and 1700 includes Chemical and Materials Engineering fields. We divided Technology Center 3600 patents (which include transportation, electronic commerce, construction, agriculture, and licensing and review patents) into two portions: electronic commerce (“3600 EC”) and the remaining fields (“3600Trad”).21
The mean of each factor in each group is an essential statistic we repeatedly cited and discussed in the results section. We summarized them in Table 2.
A. Litigated vs. Non-litigated
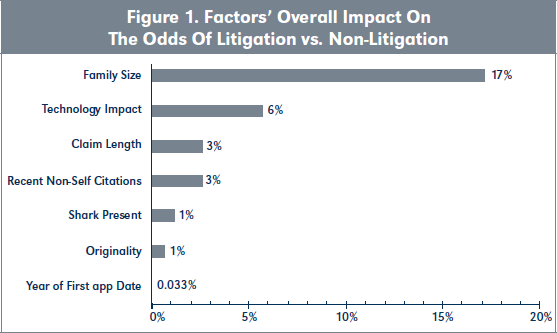
Eight of the nine factors in our logit model proved to have statistical significance. Some were relatively important, and others relatively less important. Ranking them in order of decreasing impact, the significant factors are family size, technology impact, claim length, recent non-self-citations, shark present, originality, and year of the first application date (the inverse of age). Figure 1 illustrates the impact of these factors on the odds of litigation. We defined “impact” to be the percentage change of odds of litigation resulting from an increase in a factor from the mean of the non-litigated patent families to the mean of the litigated patent families, holding all other factors in the regression constant. The mathematical expression for a factor’s overall impact on the odds follows:
Impact =e^abs[(mean(litigated) - mean(non-litigated))×coefficient] -1
Consistent with that definition, the bars in Figure 1 measure the magnitude of changes in the odds of litigation vs. non-litigation if the factor value changes from the mean of the non-litigated to the mean of the litigated patent families.
Family Size
First, the most impacting factor is family size, which is the average number of granted or pending patents in each patent family worldwide. Larger families are more likely to be litigated.
Holding all other factors constant, the impact of family size on the odds of litigation is 17 percent. In other words, if the family size increases from the mean value of the non-litigated group (8) to the mean value of the litigated group (14.8), the odds of litigation increase by 17 percent. If the patent family has one more patent, the odds of litigation increase by 2 percent.
Practitioners have noticed that patents in litigation are, on average, in a bigger family than non-litigated patents. We found that the litigated patents are in a patent family with seven more patents or publications, on average, compared with the size of the non-litigated patent family, and this difference is statistically significant. Allison and Lemley et al. (2004) found the same, even though that study didn’t evaluate how family size changes the litigation odds.
Technology Impact
Technology impact is the second most impacting factor that increases the litigation odds. This factor is based on forward references and adjusted for age and technology. The overall impact is 6 percent. As the technology impact score increases from the mean of the non-litigated group to the mean of the litigated group, the odds of litigation in crease by 6 percent. If the technology impact increases by 1 the odds of litigation increase by 7 percent.
This finding is consistent with other studies on patent characters and the likelihood of litigation. Lanjouw and Schankerman (2001) concluded that litigated patents are much more frequently cited than randomly chosen patents. Allison & Lemley et al. (2004) found that citations received is by far the strongest predictor of litigation except for individual and small-entity status; though, as discussed in the family size content above, the study did not include family size in its model.
Claim Length
Claim length is the third most impacting factor on the odds ratio. Claim length is the number of non-duplicate words in the first independent claim. We calculated claim length for each patent and then averaged the totals for the family. Patents with longer claims are more likely to be litigated. The results indicate that the odds of the litigated group, on average, is 3 percent higher than the non-litigated group because of the litigated group’s longer first independent claim. Holding all other factors in the regression constant, one more unique word in the first independent claim is likely to increase the odds of litigation by 1 percent. In the literature we reviewed, only ours studied claim length.
Recent Non-Self-Citations
“Recent non-self-citations” is the fourth most impacting factor. An increase in the number of recent non-self-citations by one causes the odds of litigation to decrease by 0.5 percent. The overall impact on the odds of litigation is three percent. Because the magnitude of the impact of one-unit change is low, it may vary in different data samples.
Shark Present
The fifth most impacting factor is “shark present.” An increase in “shark present” decreases the likelihood of litigation. It is a yes-or-no variable. It is “yes” if more than 30 percent of the forward references of a patent family are from one entity other than the assignee. It is “no” otherwise. Fifteen percent of the litigated patent families and 18 percent of the non-litigated patent families have shark-present status. The absolute value of the difference of the two values is about 3 percent. Increasing the factor by this difference, the odds will decrease by 1 percent.
Originality and Generality
Originality is the sixth most impacting factor. Its impact on the odds of litigation is one percent.22 If the originality score increases by 0.1, the likelihood of litigation decreases by 6 percent.23
Initially defined in Trajtenberg, Henderson, and Jaffe (1996) to study innovation, originality is a metric based on the breadth of technology groups of the cited patents. 24 The broader the spread of cited IPC/CPC subclasses, the higher the originality score. In Trajtenberg, Henderson, and Jaffe 1996, the authors concluded that originality does not seem to be able to discriminate between more and less basic research.25 Allison and Lemley et al. (2004) also studied the relationship between originality and the likelihood of litigation. They found that originality is not a statistically significant factor in predicting litigation. Our finding is, originality is statistically significant in predicting litigation, but the impact is low, and the higher the score, the lower the odds of litigation. Combining these findings, we conclude that a high originality score is not a strong indicator of litigation.
Generality is usually discussed together with originality. In our study, generality is not statistically significant, consistent with the finding in Allison and Lemley et al. (2004.) Generality relates to the diversity of technology groups to which citing patents belong. In other words, a patent cited by patents in many different technology areas is more general than a patent that is cited by only one or a few technology areas.
Year of the First Application Date
The year of the first application date factor is the numerical value of the year the first application was filed. Accordingly, it is a patent’s “age” in reverse—patents with a higher year are younger patents. Our result is that patents with higher years (younger patents) have a decreased likelihood of litigation. The year factor is the least impacting of all the statistically significant factors. Its impact on the odds of litigation is less than 1 percent. One additional year of patent age, all other things constant, increased the likelihood of litigation by 0.2 percent.
B. High Damages Patents vs. Non-litigated Patents
We further compared the same factors discussed in the previous section (IV.A.) between the 112 patent families that contain patents awarded damages over $100 million and the non-litigated group defined in IV.A. Our purpose was to determine whether the fac tors that significantly affect the litigation outcome are also significant in the outcome of the high damages.
As shown in Figure 2, technology impact continues to distinguish high damages and non-litigation. Moreover, it is more influential in predicting high damages vs. non-litigation than predicting litigation vs. non-litigation. Holding all other factors constant, if the technology impact score of a patent family increased from the average of non-litigated to the average of the high damages, the odds of obtaining high damages increased by over six-fold.26 With a one-unit increase in technology impact, the odds of high damages increased by more than 95 percent.
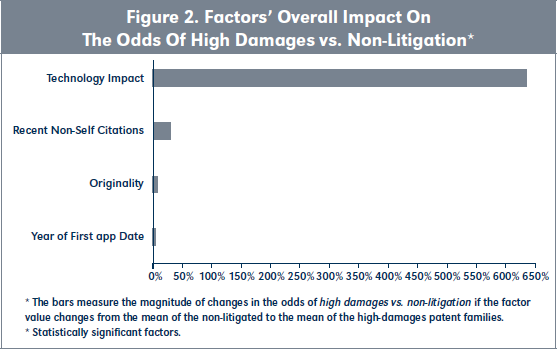
The findings on recent non-self-citations, originality, and year of the first application date factors are similar to the analysis of litigated vs. non-litigated. Family size, claim length, and shark present are insignificant factors in predicting high damages vs. non-litigation.
C. High Damages Awards Patents vs. Litigated Patents
Finally, we analyzed whether a difference existed between patents in patent families awarded high damages and other litigated patents. The results are presented in Figure 3. Table 3 summarizes the significance and impact of the factors of all three analyses.
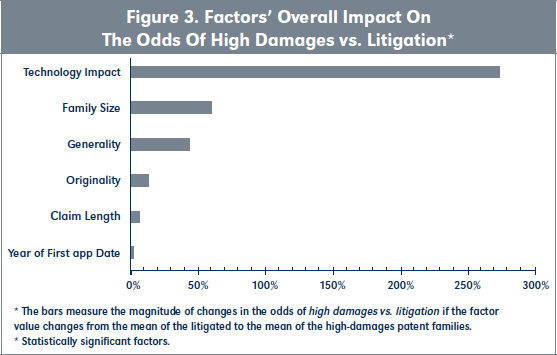
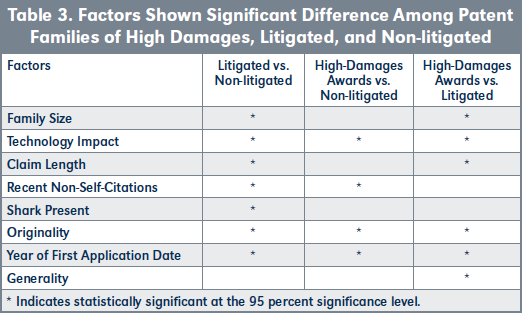
The high-damages analyses (i.e., IV.B and IV.C.) have the same finding as in the litigated vs. non-litigated analysis (i.e., IV.A) for technology impact, originality, and year of the first application date.
Consistently, technology impact significantly predicts the outcome in all three analyses. It is the second most impacting factor in the litigated vs. non-litigated analysis and the most impacting factor in the other two analyses. In the litigated vs. non-litigated analysis, its impact is 6 percent. Its impact is 635 percent in the high-damages vs. non-litigated analysis and 274 percent in the high-damages vs. litigated analysis. The odds increase with one unit increase by 7 percent, 95 percent, and 82 percent, respectively.
Originality is another factor that consistently predicts the outcome. It significantly affects the successful outcomes (i.e., litigation or high damages) in all three comparisons. A higher originality score decreases the odds. The overall impact increases from 1 percent in the first analysis to seven percent and 14 percent in the two high-damages analyses.
Year of the first application date (age) has a small, consistent impact on all analyses’ outcomes. A higher value in the year of the first application date or a younger patent family decreases the odds by 0.03 percent to 4 percent.
The high-damages analyses have different results from the litigated vs. non-litigated study for family size, claim length, recent non-self-citations, shark present, and generality.
Family size is the most impacting factor in predicting litigation vs. non-litigation, with a 17 percent impact score (2 percent for a unit change). The larger the patent family is, the higher the odds of litigation. However, the factor is insignificant in predicting the high damages vs. non-litigation (IV.B). It is, though, the second most impacting factor in predicting high damages vs. litigation (IV.C), and the impact was negative. The overall impact is 61 percent, and the unit-change impact is—5 percent. In other words, a bigger family decreases the odds of high damages vs. litigation. The high-damages patent families, on average, have a smaller family size than the litigated patent families. The mean family size is 6, 15, and 8 in the high damages, the litigated, and the non-litigated groups, respectively. This suggests that patent value and family size are related in a nonlinear fashion. Patents awarded high damages may not be among the patents that have the largest family. Still, the family size is a significant indicator in predicting the odds of litigation among the non-litigated.
Similarly, claim length is impacting in predicting litigation vs. non-litigation (IV.A) and high damages vs. litigation (IV.C), but it’s insignificant in predicting high damages vs. non-litigation. It has a 3 percent impact on litigation vs. non-litigation and 1 percent with a unit change, while it has a 6 percent impact on high damages vs. litigation and -1.3 percent in unit change.
Recent non-self-citations have a 3 percent impact on litigation vs. non-litigation and a 29 percent impact in predicting high damages vs. non-litigation. With one unit higher in the originality score, the odds of high damages and the odds of litigation decrease by 0.5 percent and 1.1 percent, respectively.
Shark present is significant only in predicting litigation vs. non-litigation. Patent families with shark present status are less likely to be litigated than the others. The overall impact is 1 percent or -28 percent with one-unit change.
Generality is an insignificant factor in predicting litigation. However, it is a strong factor in predicting high damages among the litigated patent families.
Our analysis shows that it is possible to use factors that a commercial patent database provides to successfully build a model that predicts patent value. This approach should be useful to patent portfolio owners and potential patent investors who need to compare two portfolios of patents. The approach should also be useful to those who want to prune a portfolio through paying, or not paying, maintenance fees. Although we used factors from only one commercial database (Questel), we believe other databases can be used. Publicly available data from IPR proceedings may also be useful.
We found several factors in the Questel database that affect patent value.
First, Questel’s “technology impact” factor, which is an age-controlled forward reference measure, turned out to be the strongest and most consistent among the factors we analyzed. The higher the technology impact score, the higher the likelihood of litigation, holding all other factors constant. This finding is consistent with other authors’ work. Also, we found that the factor has more impact on the odds of high damages than on the odds of litigation: on average, the patents awarded high damages have significantly higher technology impact scores than the litigated patents.
Second, we found that patent value and family size have a complicated relationship. In summary, family size is an important factor determining patent value (larger families are more likely to be litigated than small families). But patents with high damages are different: they tend to come from smaller families. To our understanding, prior authors have not identified this relationship.
Third, originality consistently impacts the odds of litigation and high damages, though its relationship is inverse. A lower originality score relates to a higher likelihood of litigation or being awarded high damages, holding all other factors constant. Generality, however, is impacting in distinguishing patents awarded high damages from the litigated patents: increased generality correlates with higher damages. But generality did not distinguish litigated from non-litigated patents.
In sum, we conclude that factors obtainable from a commercial database can be used to build a model that distinguishes valuable from non-valuable patents. Investors building such a model should expect that the factors that proved important in older studies may not be suitable for more recent patent portfolios, and they should not be surprised when factors that older papers identified as important are not significant in their new model. ■
Available at Social Science Research Network (SSRN): https://ssrn.com/abstract=4179626.