We value your privacy
We use cookies to enhance your browsing experience, serve personalized ads or content, and analyze our traffic. By clicking "Accept All", you consent to our use of cookies.
We use cookies to help you navigate efficiently and perform certain functions. You will find detailed information about all cookies under each consent category below.
The cookies that are categorized as "Necessary" are stored on your browser as they are essential for enabling the basic functionalities of the site. ...
Necessary cookies are required to enable the basic features of this site, such as providing secure log-in or adjusting your consent preferences. These cookies do not store any personally identifiable data.
No cookies to display.
Functional cookies help perform certain functionalities like sharing the content of the website on social media platforms, collecting feedback, and other third-party features.
No cookies to display.
Analytical cookies are used to understand how visitors interact with the website. These cookies help provide information on metrics such as the number of visitors, bounce rate, traffic source, etc.
No cookies to display.
Performance cookies are used to understand and analyze the key performance indexes of the website which helps in delivering a better user experience for the visitors.
No cookies to display.
Advertisement cookies are used to provide visitors with customized advertisements based on the pages you visited previously and to analyze the effectiveness of the ad campaigns.
No cookies to display.
 Mark G. Edwards
BioScience Advisors Inc.
Managing Director
Walnut Creek, CA, USA
Mark G. Edwards
BioScience Advisors Inc.
Managing Director
Walnut Creek, CA, USAAs a licensing professional in the biopharma industry for the past three decades, I’d argue that there is no component of a biopharma contract that is more heavily relied upon, and less rigorously analyzed, than the royalty rate.
Conceptually, a royalty is a series of payments based on a percentage of product sales, paid by a commercialization party to a product (or program) originator, wherein the royalty rate is intended to reflect the value of intellectual property and tangible research property that is (i) contributed by the originator and/or (ii) accumulated by the originator over a period of financial or other support by the commercialization partner.
Serious analysis of royalty rates in the biopharma sector is difficult for several reasons. First, a royalty is likely only one component of total consideration to the originator. Other components typically consist of upfront and/or annual fees, ongoing R&D reimbursement, development and regulatory milestones, deal expansion milestones (e.g. additional products or indications), and sales threshold milestones. Some agreements may additionally provide for an equity investment, profit splits in one or more regions, or payments in connection with product supply by the originator. Non-financial consideration may include limitations on fields of use or geographic markets, or cooperative assistance with respect to co-development or co-promotion.
Secondly, while most of the financial components listed above are readily (or eventually) disclosed by one or both parties to a biopharma alliance, royalty rates are typically withheld from public disclosure, or characterized in the most general of terms (e.g. “high single-digit to low double-digit royalties”).
Thirdly, aside from some early stage or settlement agreements, most biopharma alliances utilize tiered royalties, such that the actual royalty payment owed for a payment period is a function of the annual product sales during that period, multiplied by the negotiated royalty rate for each tier of sales achieved. This means there isn’t a single royalty rate, but rather 2-6 different rates, each associated with a specific range of product sales.
Fortunately, however, there is an approach that overcomes all three of these difficulties—the use of effective royalty rates (EFRs) in conjunction with analysis of unredacted biopharma agreements.
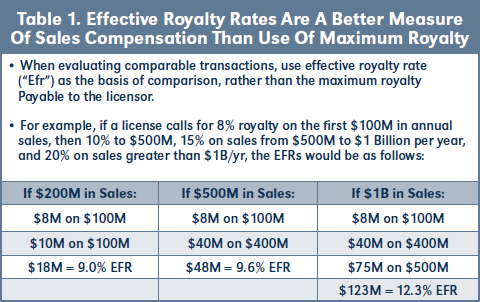
The concept of EFR entails the application of an agreement’s specific royalty rate provision to three assumed annual sales levels, namely $200M, $500M and $1 billion. As shown in Table 1 below, consider a license that calls for an 8 percent royalty on the first $100M in annual sales, then a 10 percent royalty tier for sales between $100-500M, followed by a 15 percent royalty for sales between $500M and $1B, plus a 20 percent royalty on sales greater than $1B per year. Such royalty terms might be characterized as “8-20 percent” or perhaps as “maximum 20 percent royalty.” However, by applying the specific royalty provision to the three assumed sales levels, one obtains a 9.0 percent EFR for $200M, 9.6 percent EFR for $500M and 12.3 percent EFR for $1B in assumed annual sales. For several of the analyses below, I’ll track the EFR for $500M, though it’s readily available at all three levels.
Using the BioSci deal database, BioSciDB.com, I assembled approximately 1,350 unredacted biopharma agreements commenced over the past three decades that contain one or more royalty rates expressed as a percentage of licensed product sales. Since most of these agreements were obtained via Freedom of Information Act (FOIA) requests, approximately 60 percent of the overall dataset consists of deals signed between January 1997 and December 2006, with the balance of the dataset fairly evenly divided between earlier (1987-96) and more recent (2007-16) cohorts.
For each of these unredacted agreements, BioSci’s analysts have tagged the contract’s actual royalty rate provision(s), along with any profit split or supply-related sales compensation provision. Other components of financial consideration are also noted and aggregated into “Deal Size” in several of the tables below. Most importantly, the tagged royaltChy and other sales compensation provisions, along with each component of additional financial consideration, are available for inspection by LES members on a deal-by-deal basis on the LESI website https://tinyurl.com/hngcdnf.
There are several notable findings of this study. First, biopharma EFRs range from 3-17+ percent, and increase on the basis of (i) corporate versus university licensor, (ii) exclusive versus nonexclusive license, and (ii) stage of development at signing. Secondly, as compared to worldwide alliances, preclinical and Phase I/II regional deals have higher EFRs but lower other financial consideration. Thirdly, although 18 Top Pharma outspent other licensee categories (i.e. Mid Tier Pharma, Japanese & 14 Major Biotechs), these other licensees paid higher EFRs for clinical stage deals. Fourthly, for biopharma alliances signed since 2007, average EFRs declined by 2-3 percent as compared to 1997-06 deals for compound deals involving worldwide rights. Finally, as compared to biopharma alliances signed from 1987-96, corporate preclinical deals signed since 2007 have 4-5 percent lower EFRs, while Phase III deals are 3 percent higher.
The remainder of this paper is divided into the following sections: Section II describes the methodology used in the selection, coding and analysis of biopharma alliances in the dataset; Section III discusses findings for the 60 percent cohort of deals signed from 1997-2006; Section IV discusses findings for the 20 percent cohort of deals signed from 2007-16; Section V discusses findings for the 20 percent cohort of deals signed from 1987-96; and Section VI presents conclusions and suggestions for additional research.
All of the agreements used in this study were obtained from the BioSci deal database (BiosciDB.com). BiosciDB tracks biopharma alliances and acquisitions from the early 1980s to the present. The deal database currently consists of approximately 19,000 SEC-filed contracts and amendments, of which 7,000 are redacted and 12,000 are available on an unredacted basis.
For this study, I searched for deals signed since January 1987 which are coded by BioSci’s analysts as having an EFR @ $200M sales of at least 0.5 percent. This selection criterion eliminated acquisition, supply and co-promotion agreements, as well as most distribution, joint venture and asset purchase agreements, since such deals generally don’t utilize royalty-based sales compensation.
Selection on the basis of coded EFRs also effectively eliminated redacted deals, as royalty rates are the most commonly redacted deal terms. Consequently, the vast majority of deals in the dataset are FOIA-released unredacted contracts, although some SEC-filed contracts are included that were unredacted when initially filed. The selection cutoff date was mid-December 2016. 1,359 biopharma alliances are included in the dataset on this basis.
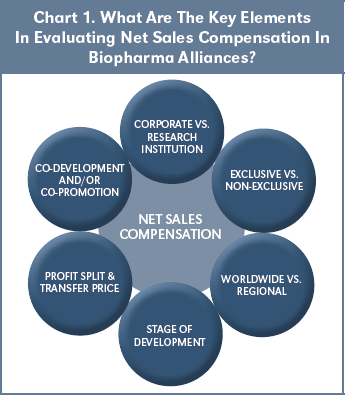
Chart 1 shows six key elements that are useful in evaluating net sales compensation in biopharma alliances. Starting at the top and proceeding clockwise, it is important to distinguish deals wherein the product (or program) originator is a corporation versus a university or other research institution. Corporate licensors are profit-driven, whereas research institutions have multiple licensing objectives, including discharging Bayh Dole obligations. Similarly, it is important to distinguish exclusive from non-exclusive licenses, as well as worldwide versus regional deals. Stage of Development at signing is an important basis for analysis, as deals signed at more advanced stages of development pre-suppose greater investment pre-signing, as well as a lower expected expenditure (and risk of failure) to commercialization. Deals having profit split or supply- based (so-called “transfer price”) sales components are important to note, since these components may increase the total sales compensation above the EFR rate. Finally, deals wherein the originator has co-development funding obligations and/or co-promotion rights may also impact sales compensation, although these aspects are beyond the scope of this study.
Chart 2 shows the average EFRs for 820 biopharma alliances signed between January 1997 and December 2006. 20 percent (163) of the deals in this cohort involve universities or other research institutions (including the NIH) as licensor. Average EFRs for these university deals are 3-4 percent, and only increase slightly based on exclusivity or higher assumed sales levels. By contrast, 80 percent (657) of the deals in this cohort involve corporate licensors. Approximately 10 percent (60) of the corporate deals are nonexclusive, and these have EFRs of 4.7-5 percent, increasing with higher assumed sales levels. 90 percent (596) of the corporate deals are exclusive, with EFRs approximately double the nonexclusive rates.
For the subset of 97- 06 exclusive corporate deals involving compounds in preclinical or more advanced development at signing, Chart 2 shows that EFRs increase by approximately 1.5 percent from preclinical to Phase I/II stage deals, and again by about 5 percent from Phase I/II to Phase III. In each subset, “Max Share” refers to the impact of profit split or supply-based sales compensation on average EFRs due to deals with these elements.
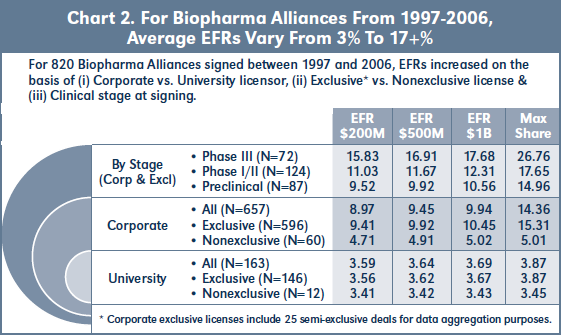
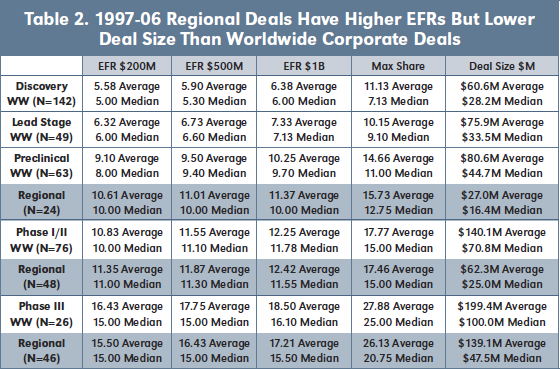
Table 2 displays average and median EFRs, Max Share and Deal Size for 97-06 worldwide and regional corporate deals by development stage at signing. As might be expected, EFRs increase, on both an average and median basis, by stage at time of signing for worldwide and regional deals, as does Deal Size. Regional deals have lower non-royalty financial consideration than worldwide deals, which is unsurprising, but higher EFRs for preclinical and Phase I/II stages, which is unexpected.
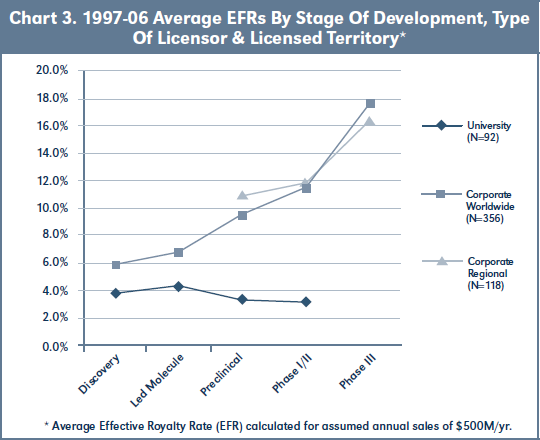
Chart 3 graphs average EFRs at assumed sales of $500M for 97-06 corporate worldwide and regional deals, as well as for university deals, by development stage at signing. Worldwide corporate deals show gains to EFR with each advance in stage at signing, with the biggest gain associated with deals commenced at Phase III. Regional corporate deals have higher EFRs than worldwide deals at preclinical and Phase I/II stages, but lower EFRs at Phase III (there are insufficient regional corporate deals at the discovery or lead stages to analyze). University deals, by contrast, show no gains to EFR associated with commencement at more advanced stages of development.
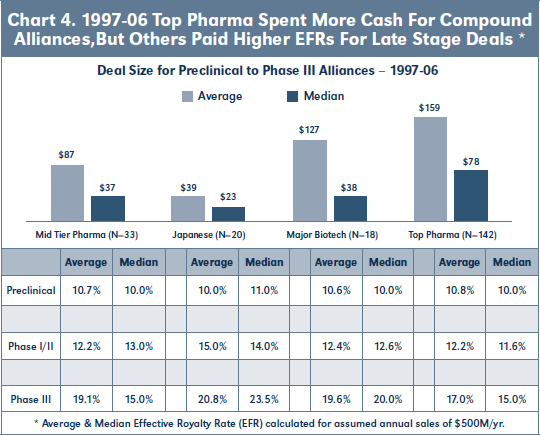
Finally with respect to the 97-06 cohort, Chart 4 shows that the average and median Deal Size for biopharma alliances involving 18 Top Pharma licensees is significantly higher than for other categories of commercialization partners, but that these other licensees agreed to higher EFRs for clinical stage deals.
Chart 5 shows the average EFRs for 276 biopharma alliances signed between January 2007 and mid-December 2016. 34 percent (94) of the deals in this cohort involve universities or other research institutions as licensor. Average EFRs for these university deals are 3-3.5 percent, and only increase slightly based on exclusivity or higher assumed sales levels. By contrast, 66 percent (182) of the deals in this cohort involve corporate licensors. Approximately 9 percent (17) of the corporate deals are nonexclusive, and these have EFRs of 4.2 percent, with little increase at higher assumed sales levels. 91 percent (165) of the corporate deals are exclusive, with EFRs approximately 2.5x the nonexclusive rates.
For the subset of 07-16 exclusive corporate deals involving compounds in preclinical or more advanced development at signing, Chart 5 shows that EFRs increase by approximately 3 percent from preclinical to Phase I/II stage deals, and again by about 6 percent from Phase I/II to Phase III.
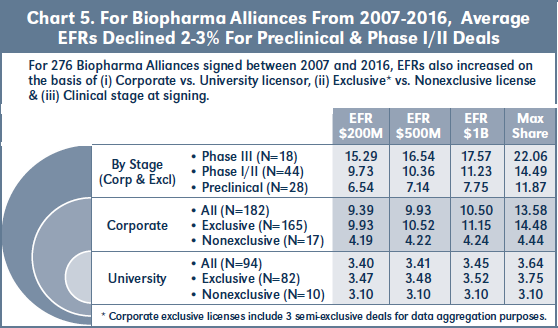

Table 3 displays average EFRs, Max Share and Deal Size for 97-06 versus 07-16 worldwide and regional corporate deals by development stage at signing. Surprisingly, other than for discovery stage deals, EFRs for 07-16 worldwide corporate deals are lower than for similar deals from 97-06. Regional deals have roughly the same EFRs for both cohorts at Phase I/II, and are higher for 07-16 deals at Phase III stage at signing. Deal Size, however, is consistently higher for the 07-16 deal cohort across all stages of development, and for both worldwide and regional deals.
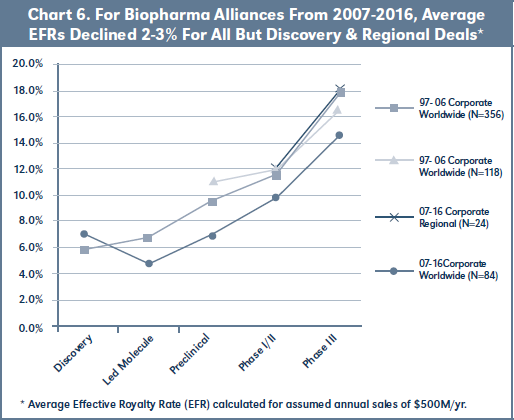
Chart 6 graphs average EFRs at assumed sales of $500M for 97-06 versus 07-16 corporate worldwide and regional deals by development stage at signing. Worldwide corporate deals in the most recent cohort show lower EFRs then deals signed in 97-06 for all but discovery stage. 07-16 regional corporate deals have similar EFRs to the 97-06 cohort for Phase I/II and III stage alliances (there are again insufficient regional corporate deals at the early stages to analyze).
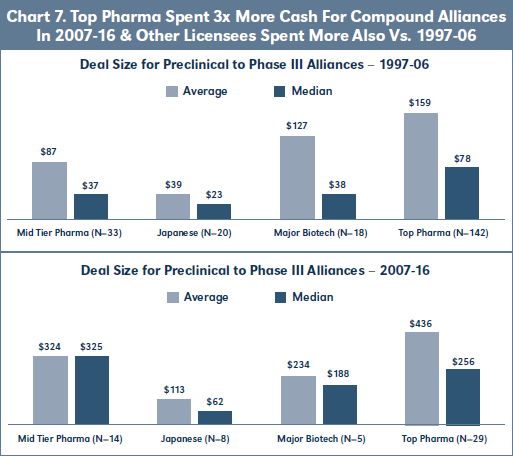
Finally with respect to the 07-16 cohort, Chart 7 shows that the average and median Deal Size for 07-16 biopharma alliances involving each category of commercialization partner is significantly greater than for the 97-06 cohort, and the increase is 3-fold with respect to the 18 Top Pharma licensees. Unfortunately, there are insufficient deals in each category of commercialization partner to analyze EFR by stage at signing for the 07-16 cohort.
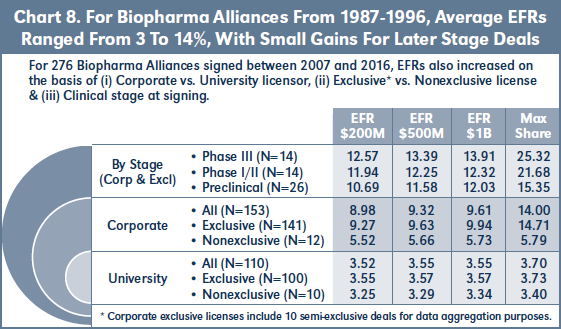
Chart 8 shows the average EFRs for 263 biopharma alliances signed between January 1987 and December 1996. 42 percent (110) of the deals in this cohort involve universities or other research institutions as licensor. Average EFRs for these university deals are 3.3-3.6 percent, and again only increase slightly based on exclusivity or higher assumed sales levels. By contrast, 58 percent (153) of the deals in this cohort involve corporate licensors. Approximately 8 percent (12) of the corporate deals are nonexclusive, and these have EFRs of 5.5-5.7 percent, increasing slightly at higher assumed sales levels. 92 percent (141) of the corporate deals are exclusive, with EFRs approximately 4 percent higher than the nonexclusive rates.
For the subset of 87-96 exclusive corporate deals involving compounds in preclinical or more advanced development at signing, Chart 8 shows that EFRs increase only 2 percent from preclinical to Phase III. However, comparison of Charts 5 & 8 reveals that average EFRs for preclinical stage deals are approximately 4 percent higher for the 87- 96 cohort as compared to the most recent deals of 07-16.
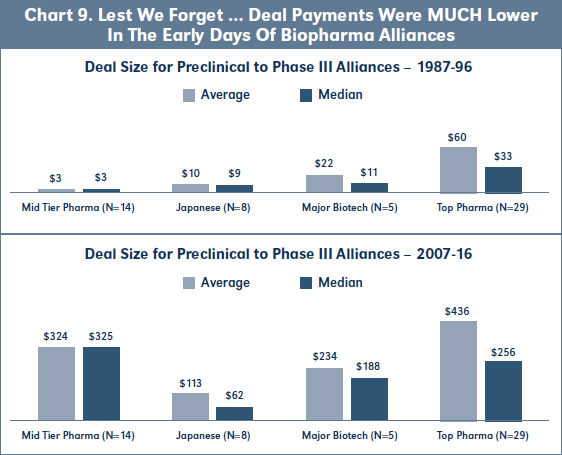
Finally, Chart 9 shows that the average and median Deal Size for 07-16 biopharma alliances has increased roughly 10-fold as compared to 87-96 deals for 18 Top Pharmas and 14 Major Biotechs, and 100- fold for Mid Tier and Japanese pharma. Again, there are insufficient deals in each category of commercialization partner to analyze EFR by stage at signing for the 87-96 cohort.
As noted at the outset of this paper, royalty rates in biopharma alliances are a singularly important and frustratingly difficult element of total financial consideration to capture for benchmarking deal terms. Effective royalty rates (EFRs) provide an easily understood tool for rendering tiered royalty rates comparable across various deal structures without losing the specific financial implications of each deal’s royalty provision. When combined with other components of total deal consideration, such as upfronts and milestones, obtained from unredacted agreements, EFRs become a cornerstone of reliable benchmarking for negotiation, transfer pricing and reasonable royalty determination purposes.
Admittedly, the royalty rate provisions of biopharma alliances are just the “base rates,” and such rates are often subject to diminution on the basis of patent invalidity, generic entry, combination products and/or third party patent stacking. In addition, as noted earlier, an originator’s co-development obligations and/ or co-promotion entitlements may significantly impact total financial consideration when these elements are present. I look forward to addressing these and related issues in future studies. ■
Available at Social Science Research Network (SSRN): https://ssrn.com/abstract=2904101