 Lew Zaretzki
Managing Director, 5G Transparency Project,
LOT Network
Los Altos, CA, USA
Lew Zaretzki
Managing Director, 5G Transparency Project,
LOT Network
Los Altos, CA, USA Tim Pohlmann
Managing Director, LexisNexis IP /
Founder, IPlytics
Berlin, Germany
Tim Pohlmann
Managing Director, LexisNexis IP /
Founder, IPlytics
Berlin, GermanyOn June 13, 2005, David Goodman and Robert Myers published their seminal paper “3G Cellular Standards and Patents”1 to support their sponsor Nokia’s licensing and litigation engagement with Qualcomm. By December 2006, Donald Martin and Carl de Meyer published their equally seminal work “Patent Counting, A Misleading Index of Patent Value: A Critique of Goodman & Myers and its Uses”² in service to their sponsor Qualcomm. Since then, such landscapes describing relative holdings of potentially essential cellular patents (“cellular patent landscapes”) and rebuttals to them have become the norm in SEP licensing and litigation.
In Nokia and OPPO’s litigation in Chongqing,³ the parties and court marshaled cellular patent landscapes from at least eight different providers before the court reached its decision. Parties, their advisors, and the courts rely upon these landscapes to unpack and adjust comparable agreements and, in some cases, to develop top-down royalty models.
Today, cellular patent landscapes also aid in valuation, portfolio benchmarking, portfolio development planning, business planning, and budgeting activities. Add to that uses in policy analysis, academic research, and regulatory activities, and we may ultimately find that there are 1,001 uses.
Analysts producing cellular patent landscapes each influence their sponsors, customers, users, and others ultimately exposed to their findings. Collectively, these analysts likely influence the thinking of the entire SEP ecosystem. For example, a typical market participant may have a deeply held conception that one firm has a better portfolio than that of another based on exposure to these cellular patent landscapes and may consequently act accordingly. Erroneous or even conflicting perceptions could lead to confusion, missed opportunities, unnecessary disputes, and other serious mistakes.
Some critics object to the entire landscaping enterprise, pointing out that no two patents are the same, and value may differ wildly even among cellular SEPs. Others point out that even the world’s finest courts can reach seemingly contradictory conclusions as to the merits of a single SEP as they did in the engagements between Philips and Belkin in the UPC and German courts,⁴ suggesting that analysis of a set of two SEPs would be even more daunting, much less a set of half a million declared SEPs. Further, courts seeking to establish the relative holdings of a single patentee similarly may differ greatly as Justice Birss’s Unwired Planet v. Huawei⁵ and Judge Selna’s TCL v. Ericsson⁶ decisions did regarding Ericsson’s portfolio (9.1 percent vs 4.7 percent). Meanwhile, others point out that it can be difficult to clearly tabulate holdings due to challenges in linking declaration data to PTO databases, properly forming patent families for these declared patents, and properly recognizing their owners.
Nevertheless, because of the market’s needs, an entire industry exists to produce cellular patent landscapes, with at least 16 independent, contemporaneous 5G patent landscapes presently commercially available. All of these inevitably draw from common sources within PTOs and SSOs, so one might assume that they are necessarily quite similar in their conclusions.
This is not the case.
The LOT Network’s 5G Transparency Project obtained these 16 landscapes and performed a meta-analysis⁷ to ascertain their degrees of similarity, difference, and collective conclusions.
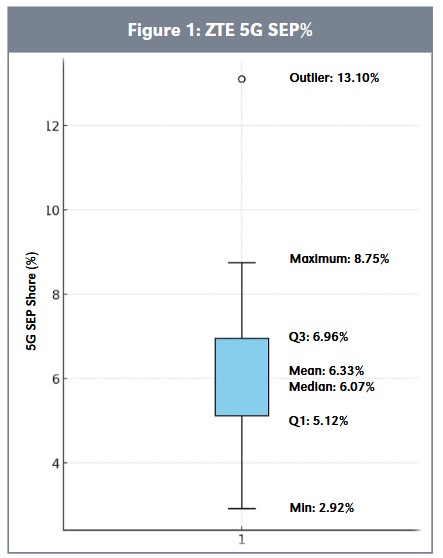 In Figure 1, we can see that landscapes differ in their conclusions about a single exemplary patentee: ZTE. Its 5G patent percent share is between 2.9 percent and 13.1 percent, a 4.5x range or a standard deviation of 0.023. The collective cellular patent landscape studies show a standard deviation of as little as 0.009 and as much as 0.028 across 10 major patentees, with 4 of the 10 studied patentees having a standard deviation equal to or larger than the patentee depicted here. These differences in cellular patent landscape conclusions could have a colossal impact. Imagine an individual working with this patentee, engaging with an individual working with a counterparty over the patentee’s portfolio. While these parties might ultimately resolve their differences, they would need to overcome quite a bit of adversity to do so.
If we extend our analysis beyond a single patentee (Figure 2), we can see that the problems expand to the point that we cannot clearly order the patentees based on their holdings—there is no “largest” position in the cellular patent landscape. For example, if we consider Huawei’s lowest estimated holding, there could be as many as six other patentees in this set, which one might construe as having larger positions in the cellular patent landscape.
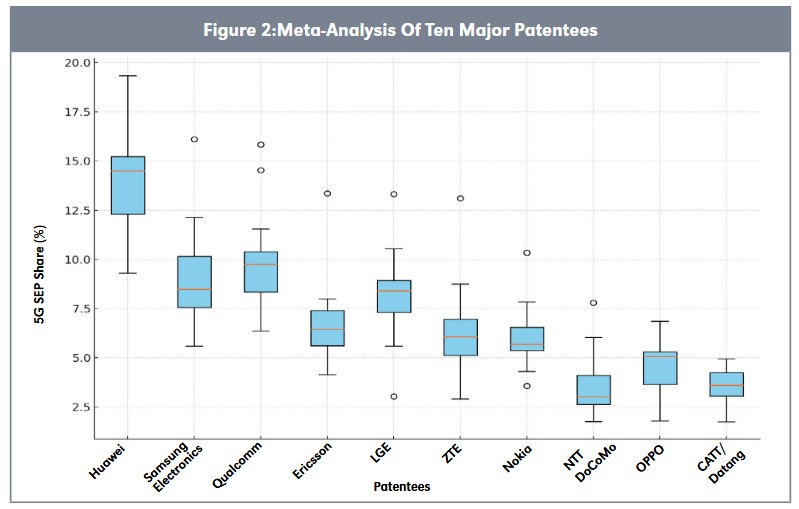
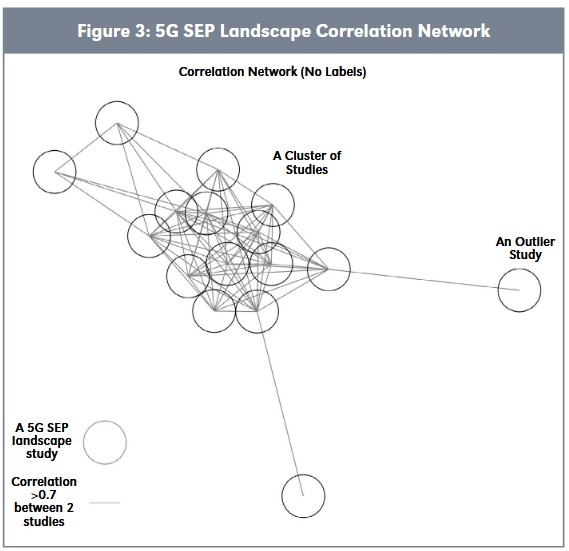
Figure 3 depicts a correlation network, with links representing a correlation of > 0.7 between a pair of 5G patent landscapes. We can see that four landscapes appear relatively loosely correlated and lie on the outskirts of the plot. Three of these landscapes have an average correlation with other studies of < 0.52. Twelve landscapes appear relatively clustered toward the center, among which are four studies with an average correlation of > 0.81.
No landscape has an average correlation > 0.835. We do not possess ground truth, so it is unclear whether a study highly correlated to other studies is more or less accurate.
So why are there such significant differences in 5G patent landscape findings, given the commonality of sources and the 5G patent landscaping endeavor itself?
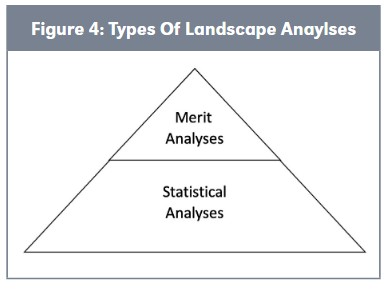
There are two fundamental types of cellular patent landscapes, with variations within each. Statistical analyses are those based exclusively upon counting quantities of cellular patent declarations, patents, families, and/or 3GPP contributions, whether individually or together in some combination. Statistical analyses are the more common of the two types and effectively
serve as a foundation for the other type: merit analyses.
Statistical analyses may appear simple in nature, but the simplicity of their output conceals substantial complexity beneath. Each such study must consider the following matters, at least:
 consider the “5G stack,” “5G only,” or alternatives)
Making appropriate choices for each of these matters and executing those choices with high quality is a substantial undertaking that requires tremendous diligence and benefits from a commitment to continuous improvement.
Merit analysis begins with the same inputs as statistical analysis and may often perform the same tasks initially. However, it layers essentiality inferences upon them. To achieve this, merit analysis entails decisions on at least several additional matters, as discussed in Figure 5.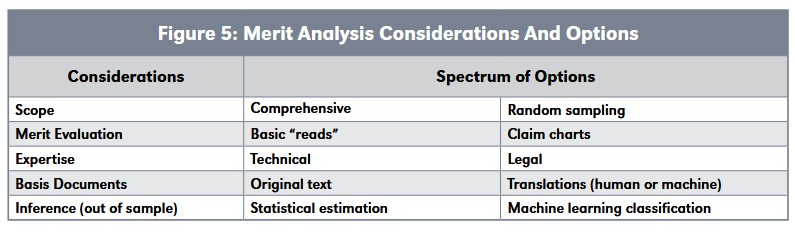
Because of the many relevant patents, merit analysis typically leverages sampling, though sample sizes may differ dramatically. One might expect random sampling,⁸ but many analysts do not discuss such details of their methods.
Performing human review, whether to determine essentiality rates or to create a training set for machine learning, depends upon an analyst’s capabilities. The output will depend upon the analyst’s collective technical and legal skill in evaluating the technologies before it, under the law in the jurisdictions filed, as described in the languages employed in those jurisdictions.
The human review may be brief, such as 30 minutes, or the analyst may review it in greater depth, achieving some degree of claim mapping, evidence of use, or even a claim chart. Each cellular patent landscape must set the threshold required for that study’s patents reads, mappings, EoUs, or charts. Each human review maybe solo or involve joint or supervised review or more sophisticated quality assurance.
Finally, given the complexities of statistical analysis and merit analysis, customers and users must always consider whether and how bias may affect each cellular patent landscape analysis. One bias of great concern to many is self-interest, especially that of sponsors seeking specified landscape outcomes that would not otherwise emerge from applying rigorous scientific methods to the source data and might remain concealed in black box-style analysis.
One cannot expect to banish differences in merit outcomes, but those differences should derive from merit analysis, not from underlying inputs and statistical analyses. And those differences should shrink to some extent with removal of such sources of error.
We have noted that all 5G patent landscapes derive from common sources within SSOs and PTOs, and we have seen that these landscapes differ substantially in their conclusions. We have also noted that all landscapes depend upon foundational statistical analysis and have touched upon a number of the challenges analysts face, including the following:
We can now discuss the nature of these challenges, the degree of their impact, and potential solutions.
Companies submit patent numbers in various formats and types, leading to inconsistencies in matching ETSI-declared patent families. Figure 6 highlights the number of non-matched ETSI-declared patent families (INPADOC) by declaring company when relying solely on unprocessed patent number declarations.
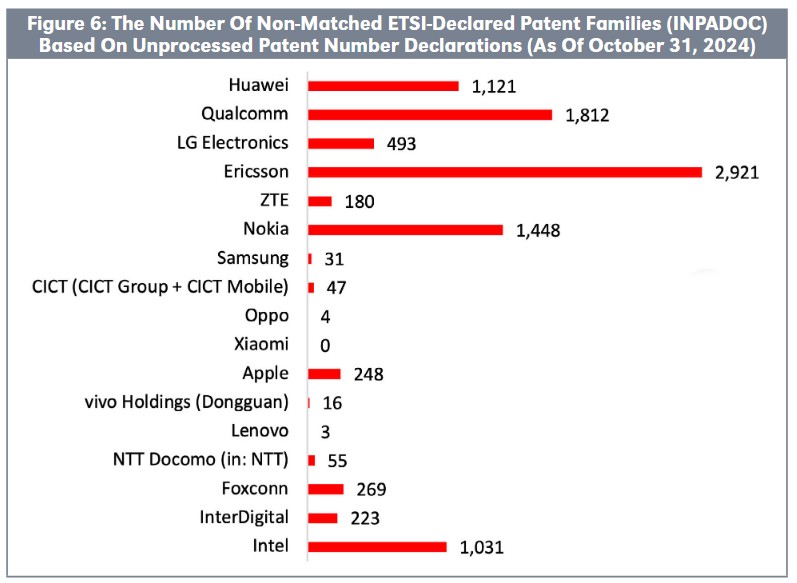
The figure underscores how differences in declaration practices across companies significantly affect matching performance. The quality and completeness of patent declarations vary widely among declaring companies. For example, companies like Xiaomi, Lenovo, and OPPO provide clear and consistent declarations, always disclosing all published patent numbers. Notably, companies with a high proportion of provisional or priority numbers in their declarations—such as Ericsson, Qualcomm, Nokia, Huawei, and Intel—show particularly high numbers of non-matched ETSI-declared patent families.
This issue poses a critical risk for 5G patent rankings that fail to rigorously account for all patent number formats, risking underrepresenting the size of certain companies’ 5G patent portfolios. Without a rigorous and comprehensive matching process, analysts may overlook entire patent families, resulting in distorted rankings and misrepresentation of portfolio sizes. Rigorous data validation ensures accurate and equitable 5G patent rankings.
Another major challenge is that the ETSI database does not comprehensively identify or maintain all patent family counterparts for declared patents. One key reason is that ETSI identifies patent family counterparts only at the time of declaration. If a patentee declares a patent before its family counterparts are published, ETSI will not update the database later to include those
additional counterparts when they become available in other jurisdictions.
While some companies proactively re-declare family counterparts as published, others only declare the initial patent application. This practice leaves many global patent family counterparts unaccounted for in the ETSI database.
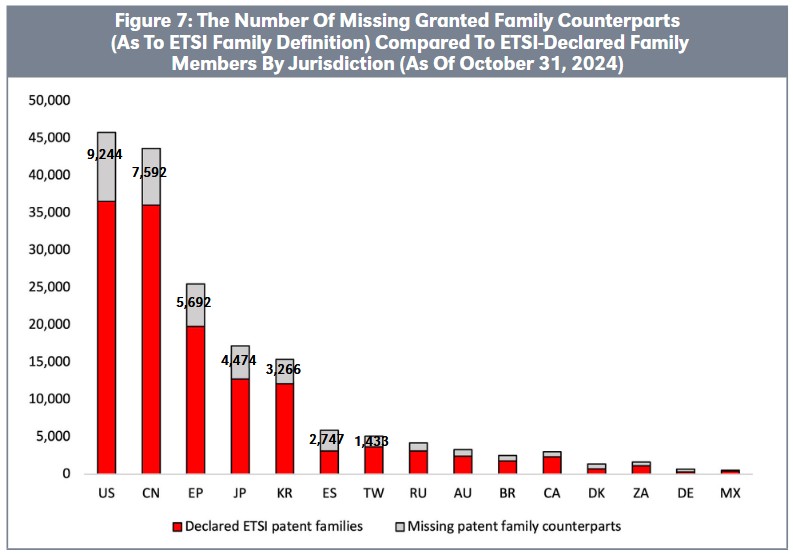
Figure 7 highlights this issue, showing that the ETSI database omits 9,244 granted U.S. patent counterparts despite the corresponding basis patent appearing. Likewise, many granted counterparts for Chinese, European, Japanese, and Korean patents do not appear. Proper family expansion considers the ETSIIPR policy, which stipulates that when a basis patentis declared, its counterparts are also subject to the FRAND commitment. Here, we determine counterparts based on ETSI’s more restrictive patent family definition compared to INPADOC.
Relying solely on ETSI-declared patents introduces a bias in jurisdiction-specific patent rankings, as it skews the data based on declaration behavior. This leads to the omission of a substantial number of granted patents, undermining the accuracy and completeness of such analyses. To ensure balanced and reliable rankings, it is essential to account for all family counter parts, regardless of their inclusion in the ETSI database.
Ownership frequently changes, especially for valuable patents such as cellular patents, and in some cases, companies engage in substantial M&A. For example, patentees such as Ericsson (Unwired Planet, 2013), Nokia (Conversant, 2013), Interdigital (Intel, 2012), Motorola Mobility (Google, 2012), Infineon (Intel,2011), and the Nortel bankruptcy auction (Rockstar,2011) have engaged in major M&A, which included substantial quantities of potential cellular SEPs. If analysts obtain outdated patent ownership data, cannot rigorously track transfers in global patent office data, fail to apply comprehensive and accurate corporate tree information, and do not properly harmonize assignees, patent owner rankings will be highly inaccurate and misleading.
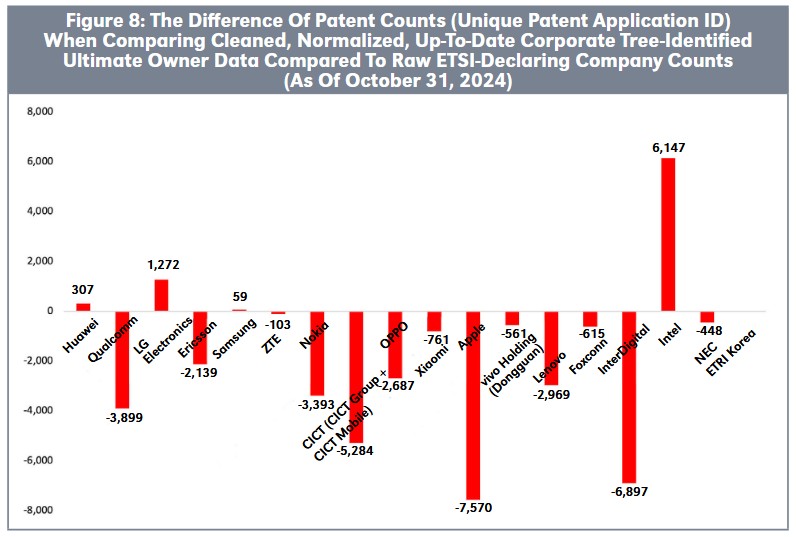
Figure 8 illustrates the significant difference between rankings based on cleaned, normalized, and up to-date ultimate owner data, identified through corporate trees, versus those relying on raw ETSI-dclared company names. For example, Figure 8 shows that a significant portion of the Intel portfolio acquired by Apple would still incorrectly appear as owned by Intel. Companies like Huawei, LG, or Samsung, which have sold parts of their portfolios, would show inflated patent counts. Conversely, Nokia, Interdigital, CICT, Qualcomm, and Lenovo will appear underrepresented if without proper owner name normalization and recognition of subsidiaries.
ETSI-declaring companies often have the best understanding of their declared patent portfolios and can quickly identify inaccuracies in reports about them. However, they typically do not share this information openly with cellular landscape analysts.
To address these challenges, LexisNexis IPlytics launched the Cellular Verified⁹ declaration data cleaning initiative, partnering with over 30 ETSI-declaring companies. The feedback from these 30+ companies, including the largest SEP licensors as well as the largest standards implementers, helped refine patent number matching rules, identify missing patent family counterparts, remove falsely declared patents, confirm global patent ownership, and improve the classification into 3G, 4G, and 5G.
By comparing the public ETSI data with each company’s internal records, the Cellular Verified Initiative ensured the highest level of accuracy and reliability in 4G and 5G patent data, providing the industry with a trusted benchmark. This effort ensured the Identification of all publicly declared patents, resulting in a clean and unbiased database that produces accurate and impartial
patent counting statistics. To avoid any misunderstanding, the Cellular Verified Initiative did not ask any of the ETSI-declaring companies to make comments about the essentiality or validity of their declared patents.
The following example demonstrates how raw ETSI data can lead to significantly different and inaccurate rankings that underrepresent certain companies’ 5G patent portfolios.
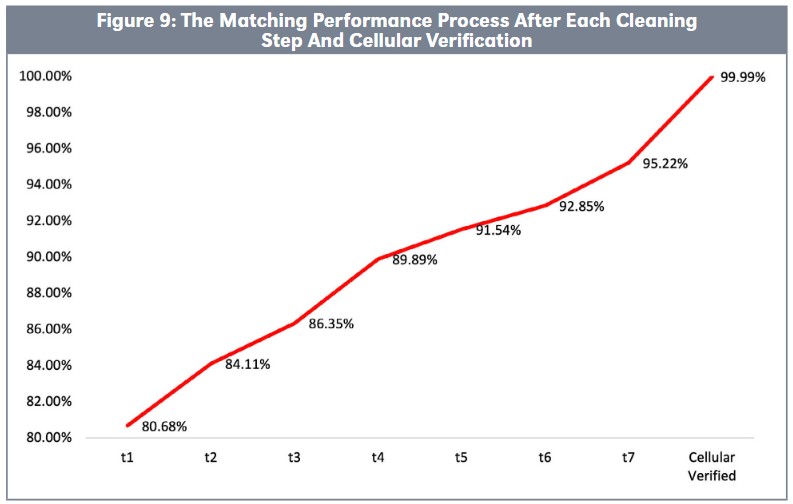
Figure 9 illustrates the progress of matching and cleaning efforts, showing how the average matching rate improved from t1 (initial matching efforts) to t7 (final application of matching processes). One significant cleaning step included a thorough investigation of identifying and matching provisional and priority patent application numbers between t6 and t7. While rigorous cleaning substantially enhances data accuracy, achieving a perfect match rate is nearly unattainable without direct input from declaring companies responsible for the declared patents. Figure 9 illustrates that the Cellular Verified Initiative successfully increased the matching accuracy to ultimately achieve 99.99 percent accuracy of all published patent documents.¹⁰
This Initiative underscores the importance of collaboration and advanced data processing in producing reliable 4G and 5G patent data information. The Cellular Verified data ensures that 5G declared patent rankings represent 99.99 percent of those patents declared at ETSI, independent of a company’s declaration behavior.
Cellular SEP market participants require accurate landscape information for many reasons, but the difficulties in developing it may frustrate their desires or lead to confusion due to conflicting landscapes. To improve the situation, we suggest the following:

 Latest Articles Of The Month