 Animesh Giri
Senior Associate
The Brattle Group
Washington, DC
Animesh Giri
Senior Associate
The Brattle Group
Washington, DC  Jonathan Lee
Senior Associate
The Brattle Group
Toronto, ON
Jonathan Lee
Senior Associate
The Brattle Group
Toronto, ON  Karen Gover
Associate
Wolf Greenfield
Boston, MA
Karen Gover
Associate
Wolf Greenfield
Boston, MA Marie McKiernan
Professional Development Manager
Wolf Greenfield
Boston, MA
Marie McKiernan
Professional Development Manager
Wolf Greenfield
Boston, MAEstimating lost profits in patent litigation requires reconstructing a counterfactual “but-for world” in which the alleged infringement did not occur. This article examines how products that practice the prior art can serve as practical, market-based benchmarks for lost profits analyses when direct licensing evidence is limited or unreliable. We explain how prior art products clarify both the plaintiff’s competitive position and the defendant’s available non-infringing alternatives, and we discuss how standard economic tools can leverage observed substitution patterns to isolate the incremental value of patented features. We conclude that prior art products can materially strengthen the economic foundation of lost profits analyses.
The concept of the “but-for world” lies at the heart of a lost profits analysis, which measures the profits that a plaintiff would have earned but for the defendant’s infringement. The challenge of such an analysis is that it requires the analytical equivalent of both a time machine and a crystal ball: the expert must reconstruct the market’s past, while considering how it might have unfolded differently under different circumstances. A jury (or the court) has to determine what would have happened, counterfactually, but for the infringement – what would the market value of a license have been, at the time? How many products would the patent owner have sold? What profits would the patent owner have earned, but for the infringer’s acts?
The many variables involved, such as market fluctuations, competitor products, and changes in technology over time, further complicate the equation. For this reason, economic experts often look to concrete measurements of value, such as existing licenses for the patent that were sold to others, when making their calculations. Unfortunately, information on existing or comparable licenses may not be readily available (if they exist at all).
However, another sort of benchmark sometimes exists: products that embody or practice the prior art cited by the allegedly-infringed patent. These “prior art products” can inform the construction of the but-for world that the patent damages calculation requires, either by clarifying the defendant’s available alternatives, the plaintiff’s pre-existing market position, or both. In these cases, lost profits may be calculated relative to the but-for world in which the defendant marketed these prior art products instead of allegedly-infringing products.
In this article, we examine how prior art products, when available, can serve as concrete, market based benchmarks for lost profits analyses in patent litigation. The article proceeds in four sections. First, we discuss why, conceptually, prior art products can serve as a useful comparator for the economic expert. Second, we review some well-known tools in the economic expert’s toolbox and demonstrate how prior art products can make those tools especially useful in patent infringement cases. Third, we take a deeper dive into the underlying economic and competitive dynamics of a lost profits analysis that prior art products can illuminate. Fourth, we discuss the implications of our findings for litigation strategy, applicable to both plaintiffs and defendants.
Damages awards for patent infringement generally take two forms: lost profits or reasonable royalties. The basic principle behind both approaches is to put the patent owner in the same position they would have been in had the infringement not occurred.
An added complication to the damages analysis is the principle of apportionment. Apportionment is not expressly required by the patent statute, 35 U.S.C. § 284, which merely promises that the patent owner will be compensated by damages “adequate to” the infringement. “Apportionment” means that, in a damages award for infringement, the patent owner is only entitled to the incremental value that is specifically attributable to the patented technology. It was first introduced by the Supreme Court in the 1853 case Seymour v. McCormick, which involved patented improvements to a reaping machine. There, the Court reversed and remanded a patent damages award as excessive. It cautioned against awarding lost profits for the value of the whole machine when the infringed patent covered only a small improvement over the prior art.¹
There, the Court was clearly concerned that patent owners could reap a windfall in damages awards when the invention infringed was not the entire machine, but merely some trivial improvement on the existing technology. Apportionment prevents patentees from extracting a larger award than is necessary to compensate for the harm caused by infringement of their patent.
However, in the past decade, as the size of patent damages awards has become a focus of debate, some commentators have argued that the Federal Circuit has strayed from the apportionment principle by permitting so-called “built-in apportionment” in damages calculations.² Built-in apportionment is an indirect way of determining a per-unit royalty for a product that practices a patented technology. It begins with a lump-sum license and then divides that sum by the number of projected units to arrive at a per-unit royalty rate, based on the assumption that the negotiators of that lump-sum license accounted for the value of the asserted patent in arriving at that license amount. ³ These commentators have argued that built-in apportionment is a flawed method because lump-sum licenses often do not reflect an accurate per-unit royalty assessment, and they caution that such licenses can also be manipulated to yield an artificially high per-unit rate.⁴
In the recent EcoFactor v. Google matter, the Federal Circuit rejected an expert’s use of “built-in apportionment,” reflecting the court’s concern with the reliability of such techniques. In EcoFactor, one of the three license agreements relied on by the expert did not involve the patent-in-suit at all, and the other two were lump-sum agreements covering EcoFactor’s entire patent portfolio – with no indication that the licensees agreed to pay a per-unit rate for the asserted patent. The court found the expert’s methodology relied on licenses that were insufficient and misleading under Daubert.⁵ The decision reflects the view that damages are more reliable when grounded in concrete economic evidence rather than abstract shortcuts.
Prior art products offer precisely this kind of evidence. Unlike license-derived formulas, prior art products are often tangible, sold in real markets, and directly comparable to the patented invention. In infringement disputes, attorneys often use prior art strategically to challenge or defend a patent’s non obviousness, but it can also play a central role in assessing damages. By showing what features were already available, prior art products can help isolate the incremental value of the patented invention, just as the Supreme Court did in apportioning the value of McCormick’s patented improvement (a convenient seat for the grain-raker) to the prior art reaping machine.
That incremental value, in turn, sheds light on the profits associated with market exclusivity – and in the context of infringement, on the losses from its erosion. Likewise, if the defendant markets prior art products, they can serve as benchmarks for evaluating how much the patented features – rather than other factors – contributed to the defendant’s market gains and the plaintiff’s corresponding losses.
Thus, in many circumstances, prior art products can inform the construction of the but-for world that the patent damages calculation requires, either by clarifying the plaintiff’s pre-existing market position, the defendant’s available alternatives, or both.
Many of the analytical tools available to economic experts are well-suited to estimating the incremental value of a patented invention by analyzing observed or reported market outcomes across products – some that include the patented features and others that do not. Products that embody the patent’s prior art are particularly useful in such analyses: they help quantify the incremental value of the patented features and ensure that the economic assessment is directly tied to the scope of the claimed invention.
One of the analytical tools commonly used in this context is a conjoint survey, which estimates how much consumers value specific features – such as those claimed in a patent – by observing how they trade off attributes when choosing among product alternatives. In a choice-based conjoint (CBC), for example, respondents are typically shown sets of hypothetical products that differ in key characteristics – e.g., price, functionality, brand, or performance – and are asked which product they would prefer or be willing to purchase.⁶ A conjoint survey can therefore isolate consumers’ value of the patented feature itself, holding other factors – such as brand, distribution, or price levels – constant. Moreover, existing prior art products can improve the realism and credibility of the conjoint design: their actual price points and technical attributes can serve as anchors for the survey’s choice sets, and their observed sales data can be used to validate or calibrate the conjoint model’s predictions.⁷
Another tool in the economic expert’s toolkit is hedonic regression, which estimates the value of specific product features – such as patented innovations – using observed market data rather than survey-based consumer responses.⁸ In this regression-based analysis, the prices of products in the marketplace are statistically modeled as a function of their attributes. The estimated coefficients indicate how much each attribute contributes to the overall market price. For example, in a market for smartwatches, a hedonic model might estimate how much of the price variation across models is explained by differences in battery life, display quality, connectivity features, and brand reputation.
Like conjoint surveys, hedonic regression aims to measure the marginal economic value of the patented feature. Instead of survey-based trade offs, however, hedonic regression relies on actual market behavior, capturing the revealed preferences of consumers who made real purchasing decisions. To produce useful results, a hedonic regression requires sufficient variation in purchased product characteristics in the available data, and there needs to be a discernible relationship between the patents of interest and product characteristics. When prior art products are present in the dataset, they provide real-world benchmarks that help separate the contribution of patented features from those already available in earlier designs – going a long way to ensure that the data are suitable for hedonic regression. This linkage to prior art strengthens the economic analysis, anchoring the estimated feature values in actual market conditions rather than in hypothetical ones.
Finally, an economic expert can directly construct a model of the relevant market, including products that practice the patent and those that practice prior art as options for consumers in that model. Indeed, in many cases, such a model may be required to reliably predict outcomes in the but-for world, even when using the conjoint survey or hedonic regression tools mentioned above.
Next, we discuss how an economic expert might use prior art products to inform their construction of such economic models, discussing how prior art products can help determine how the market might adjust in the but-for world, demonstrating the ways in which prior art products can impact lost profits calculations depending on the specific case at issue.
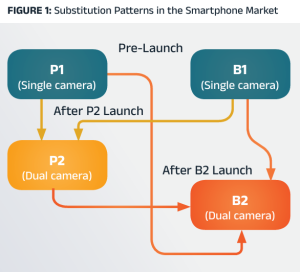
Consider a hypothetical market for smartphones. There are two manufacturers in this market, Plantain and Banana, and initially both companies market smartphones with a single rear camera, the P1 and B1, respectively. Plantain’s R&D team develops a smartphone with a dual rear camera – the P2 – and obtains a patent on the use of dual rear cameras in smartphones. Plantain’s patent identifies prior art covering the use of a single rear camera on smartphones. Banana, not to be outdone, develops and launches its own smartphone with a dual rear camera, the B2. Plantain then sues Banana for patent infringement, citing Banana’s use of dual rear cameras on the B2.
Prior to the launch of the patented P2, Plantain’s P1 and Banana’s B1 each maintained a consistent share of the smartphone market. When Plantain’s P2 launches, its sales come from two sources: Plantain’s cannibalization of its own sales of P1 phones and Banana’s lost sales of B1 phones.⁹ In Banana’s case, however, sales of the infringing B2 after its launch come from three sources: Plantain’s lost P1 sales, Plantain’s lost P2 sales, and Banana’s cannibalization of its own B1 sales.
Figure 1 illustrates the evolution of the market and related substitution patterns. Before the introduction of any dual-camera products, the blue ovals labeled P1 and B1 represent the single-camera status quo. After the launch of Plantain’s patented P2, the two yellow lines show substitution toward P2. Following the subsequent launch of Banana’s infringing B2, the three orange lines indicate the three sources of substitution driving B2’s sales.
The prior art products P1 and B1 in this market can help understand the incremental value associated with Plantain’s patented dual rear camera feature, informing a lost profits calculation, in two main ways. First, P1 and B1 can act as benchmarks; the parties’ losses in their respective prior art products upon the launch of their new products capture the incremental value of the dual-camera feature. Second, substitution from one party’s prior art product to their competitor’s innovative product informs which sales constitute Plantain’s damages and Banana’s ill gotten gains – and which sales do not. We consider each in turn, then discuss variations on the setting and the subsequent implications for analysis.
III.A. Benchmarks
Market outcomes for P1 and B1, such as prices and market shares, can serve as points of comparison for measuring the market success of P2 and B2. These comparisons can indicate the incremental value provided by the patented functionality, especially if other features of the products are similar. In the simplest case, if Plantain sells P1 for $499 and sells its P2 for $599, then the incremental market value of the second rear camera is about $100.¹⁰
Benchmark-style analysis is more difficult if one tries to compare products across companies – e.g., a comparison of the prior art P1 against the infringing B2 – should a within-company benchmark product not be available. Even if the products are identical save the second rear camera, differing brand names, manufacturing costs, and installed user base make an “apples-to-apples” comparison difficult. A proper comparison across companies, therefore, requires an understanding of customer substitution patterns between the companies’ various products on offer.
III.B. Substitution
When Plantain launches the P2, it draws sales from erstwhile purchases of the P1 and B1 smartphones (the yellow lines in Figure 1 above). Both paths will be driven, at least in part, by the introduction of the second camera, and both will therefore inform us of the value of the patented features relative to prior art products: if P2 generates large sales volumes, then consumers place a high value on the patented features, and vice versa. Whether the draw from P1 or B1 sales is larger will depend on consumer preferences for the Plantain and Banana brands as well as the difference in other features offered on the devices.
Similarly, when Banana launches the B2, it draws sales from consumers who would otherwise have purchased the P1, B1, or P2 smartphones (the orange lines in Figure 1 above). Again, assuming that the only differentiating feature of the B2 is the patented dual rear camera, sales diverted to B2 from both P1 and P2 qualify as lost sales due to infringement. Likewise, sales diverted to B2 from B1 can add to Banana’s gains from infringing Plantain’s patent if, for instance, B2 can command a price premium over B1.
In this example, observed substitution patterns from prior art products to practicing or infringing products give a clear indication of Plantain’s lost sales and Banana’s ill-gotten gains from Banana’s infringement of Plantain’s patent.
However, if the parties’ product launches overlap, or if B2 does include differentiating features, or if Banana’s brand itself simply has some differentiating value in the marketplace, then deriving the incremental value of the patented feature becomes less clear-cut. A qualified economic expert can often use evidence on market outcomes of the products that do exist, applying the techniques mentioned earlier, to infer underlying substitution patterns and disentangle the value of the patented features themselves.
III.C. Disentangling Effects
If P2 and B2 launch roughly concurrently, then previous purchasers of P1 and B1 devices have two new choices, and disentangling substitution effects becomes more difficult. At minimum, P2 is distinguished from P1 by the patented features, while B2 is distinguished from P1 by both the patented features and brand-level differences between Banana and Plantain. In such markets, sales diverted from P1 to B2 are driven at least partially by Banana’s brand value – indeed, if B1 does not exist in the market, P1 to-B2 substitution may be driven by brand alone.
The methods previously discussed – conjoint analysis, hedonic regression, and market modeling – can help isolate substitution driven by patented/ infringing features from brand value and other drivers of consumer demand, and consideration of prior art products can enhance the ability of these methods to produce insightful results. These effects impact the calculation of monetary remedies, and can therefore impact litigation strategy more broadly, as discussed below.
The inferential nature of estimating lost profits in a but-for world has important considerations for how the litigating parties might factor prior art products into their overall strategy, at least as it relates to evidence on damages for infringement.
For example, plaintiffs may want to highlight evidence that contrasts the value of prior art products with that of the patent-practicing product, demonstrating the desirability of the patented improvement – the very fact that Banana launched an infringing B2 phone shows that the invention was valuable to consumers, and if B2 commands a price premium over prior art products P1 or B1, that provides further evidence on the patent’s apportioned value. The plaintiff could also seek production of any internal studies from the defendant assessing consumer demand for the patented feature, contrasting with demand for contemporary prior art products.
Similarly, defendants may want to highlight evidence that the value consumers place on their infringing product derives not from the patented feature but from other sources. For instance, the defendant could produce evidence that their infringing product diverted sales from their own prior art product offering instead of the plaintiff’s products; evidence on costs of production to demonstrate that observed pricing differences between infringing and prior art products are driven by production costs, not consumer demand for the patented feature; or evidence demonstrating that consumers valued aspects of their product offering unrelated to the patented technology, such as their brand reputation or their own technology, that were available in both infringing and prior art products.
In summary, prior art products present a particularly suitable grounding point for lost profits analyses in patent litigation. Data on prior art products can make the tools in an economic expert’s toolbox more powerful and effective, helping the economic expert isolate the value of the patented feature in an allegedly infringing product from other drivers of value, such as other features or brand value. Given the scrutiny placed recently by the courts on the size of patent damage awards, such direct benchmarks may become increasingly important for economic experts, plaintiffs, and defendants.

 Latest Articles Of The Month