les Nouvelles October 2021 Article of the Month:
Business Research Skills As Facilitators Of Biopharmaceutical Non-Core Patent Out-Licensing
Founder/Principal,
COZAREN GmbH,
Basel, Switzerland
Abstract
A European Commission report into patent licensing (Radauer and Dudenbostel 2013) concluded that the technology industry out-licenses more non-core patents than the pharmaceutical industry. A literature review suggests that this variation may be due to the perceived risks associated with holding patents in both industries, and these differences influence business models within each industry.
Two distinct groups of patent professionals were identified; those within technology (referred to in this paper as technology patent professionals, or TPPs) and those in the Swiss pharmaceutical industry (or SPPPs). From a review of the literature, five business research skills were identified as being effective facilitators of successful patent licensing. Statistical analyses of the survey responses show that TPPs are more proficient in these skills than SPPPs. This discrepancy suggests a need for SPPPs to receive more business research training to achieve higher levels of non-core patent out-licensing. Findings from this study are used to develop a new workflow model that encompasses the application of these research skills to generate economic value in the form of extra revenue and cost savings. The global applicability of this model is suggested as an area for future research.
Need for New Revenue Generation Strategy
All pharmaceutical companies are facing rising research and development (R&D) costs and more frequent government-imposed price controls, while clinical trial failures are increasing (Berndt, et al. 2015, Chesbrough and Chen 2013). Moreover, industry competition is resulting in less potential for one company’s drug to dominate a market (Berndt, et al. 2015, Chen and Zhao 2010, Chesbrough and Chen 2013, Song and Han 2016). Therefore, new revenue generation strategies are needed to enable Swiss pharmaceutical companies to meet these economic challenges (Grass and Mösle 2015).
CEOs of several pharmaceutical companies have resorted to mergers and acquisitions in an attempt to improve their economic growth, but this strategy has met with only limited success (Danzon, Epstein and Nicholson 2007, Demirbag, Ng and Tatoglu 2007, Josselyn 2015, Kirchhoff and Schiereck 2011). The reason appears to be the inability of the acquiring companies to be able to commercially exploit their newly acquired products (Mousavi 2011).
Other CEOs of technology companies have adopted the practice of patent pooling, where patent rights of two or more organizations are bundled together and collectively licensed to facilitate access to new innovations (Jeitschko and Zhang 2014). Another common practice is known as open innovation. This practice enables the external sourcing of ideas and products for internal exploitation and vice versa, often through collaborations (Aoki and Schiff 2008, Hunter and Stephens 2010). These practices enable access to new products while minimizing litigation risk. However, open innovation has been less successful in the pharmaceutical industry due to the lack of tacit knowledge needed by acquirers to make pharmaceutical inventions commercially exploitable (Jeitschko and Zhang 2014, Lee 2012).
There are two main reasons for this. First, negotiating multiple licenses with multiple parties in the patent pool incurs high costs (Aoki and Schiff 2008). Second, the risk of regulatory scrutiny rises due to the inherent tendency of patent pools to create monopolies (Rodriguez 2010).
Up to 95 percent of patent portfolios held by pharmaceutical companies have no immediate strategic value (non-core patents) (Moss 2015), and out-licensing these portfolios has been suggested as a viable economic strategy by some authors (Goldheim, Slowinski, et al. 2005).
The feasibility of this strategy is further supported by a recent European Commission (EC) report (PATLICE) (Radauer and Dudenbostel 2013). The authors of the report analyzed the patent licensing activities of companies based in the European Union (EU) and Switzerland. They found that 67 percent of healthcare organizations, including pharmaceutical companies, actively out-license patent portfolios. However, a large majority of the transactions involved only core patents (patents linked to the organization’s core business strengths or focus).
In contrast, within the technology industry there is almost an equal out-licensing of core and non-core patent portfolios (Radauer and Dudenbostel 2013). The report also notes that a major challenge to patent out-licensing in the biopharmaceutical industry is the lack of skills needed to identify suitable licensing partners and the inability to attract the right price for their inventions, with the lack of information needed to price their patent assets following close behind (Radauer and Dudenbostel 2013, 44-45). These findings suggest that TPPs are more proficient at identifying out-licensing opportunities for their non-core patents than SPPPs (Radauer and Dudenbostel 2013, 42).
This study investigates whether TPPs have greater abilities in business research than SPPPs and, if so, whether this explains the observed higher levels of non-core patent out-licensing by the technology industry. Therefore, the research questions to be addressed in this study are:
- Do TPPs and SPPPs have the same level of interest in non-core patent licensing?
- Do TPPs and SPPPs employ business research skills with a similar frequency?
- What proportion of SPPPs and TPPs require further business research training?
Research Gap
Several studies have highlighted the economic benefits associated with non-core patent out-licensing in knowledge-based industries (Goldheim, Slowinski, et al. 2005). However, this author could find no studies on the proficiency of SPPs in applying their business research skills. Such skills are required for increasing non-core patent out-licensing activities, thereby turning these patents into strategic assets (Rivette and Kline 2000).
Business Research Skills
Patent professionals need to have a range of business research skills to manage non-core patent portfolios successfully (Bader, et al. 2012, Chan 2007, Sullivan and Harrison 2008). Other researchers regard business research skills as necessary for enabling patent out-licensing activities (Carson 2008, Chan 2007, European Patent Office 2017, Hadzima Jr. 2015, Kaplan and Norton 2004, Lichtenthaler 2011, Simpson and Langloi 1998). Such skills are also essential for gathering information to support strategic planning and decisions (Vuori 2009). Furthermore, there is evidence that an organization’s competitive behavior is linked to its patent licensing strategies (Saracho 2005).
Five business research skills are crucial to facilitating patent licensing activities (Carson 2008, Grézes 2015, McGonagle and Vella 2012). These skills relate to:
- Patent portfolio reviews/audits;
- Patent searching, mapping and landscaping;
- Competitor intelligence;
- Market intelligence; and,
- Patent valuation.
Patent Portfolio Review. Regular reviews of patent portfolios can ensure that patents remain aligned to current and future product developments (Bader, et al. 2012, Sullivan and Harrison 2008). This activity ensures optimum protection of patent portfolios while, simultaneously, identifying non-core patents that may be out-licensed to generate revenue and minimize maintenance costs and litigation risks (Goldheim, Slowinski, et al. 2005, Knowles, et al. 2013, McGavock and Newell 2007).
Patent searching/mapping/landscaping. Patent searching, mapping or landscaping is crucial to effective portfolio management (Hadzima Jr. 2015, McGavock and Newell 2007). All three activities are integral to identifying third-party infringement of own patents and potential licensees operating in similar R&D fields (Cantrell 1996, Chan 2007, Nelke and Håkansson 2015, Salvador and Tello Bañuelos 2012).
Competitor Intelligence. With regard to patents, competitor intelligence relates to the gathering of information about patent portfolios, technical capabilities and target markets of competitors (McGonagle and Vella 2012, 14,15). It is essential for shaping patent out-licensing strategies and managing business risks, such as the potential for generating adverse publicity by asserting own non-core patent rights against infringers (Hadzima Jr. 2015, McGonagle and Vella 2012). Competitor intelligence may also be useful for defining the relative competitive position of one’s patent portfolios, identifying potential licensees, and facilitating optimum valuation of patent portfolios (Carson 2008, Goldheim, Slowinski, et al. 2005, Pargaonkar 2016).
Market Intelligence. Although influenced by competitor intelligence research, market intelligence is primarily concerned with current market trends, such as pricing, sales and market visibility (McGonagle and Vella 2012, 16). Market intelligence may help with market forecasting, monitoring the commercial value of similar patents, gaining insights into the commercial impact of licensing deals and identifying potential new markets (Carson 2008, Goldheim, Slowinski, et al. 2005, Pargaonkar 2016, Wirtz 2012).
Patent Valuation Skills. The value of an innovative organization’s patent portfolio will influence its overall commercial valuation (Goldheim, Slowinski, et al. 2005, Hu, Bian and Wang 2008). The analyses of the legal status, international scope, forward citations and opposition/litigation of patents are the most important indicators of patent value irrespective of technical subject matter (Olmand 2011, Wirtz 2012, Grimaldi, Cricelli and Rogo 2018, OECD 2015, Hu, Bian and Wang 2008, European Commission 2006).
Legal status. This is an important determinant of patent value because patents granted in a jurisdiction discourage competitors from using/commercializing an invention in that jurisdiction (Olmand 2011, Hu, Bian and Wang 2008, Kapoor, Karvonen and Kässi 2013, Grimaldi, Cricelli and Rogo 2018).
International scope. This relates to the geographical markets where patent protection is sought. It is important because there is a positive correlation between patent value and the extent of market coverage (Grimaldi, Cricelli and Rogo 2018).
Forward citation. A new patent may reference an older, more established patent. The greater the number of such references to an established patent, the greater its significance or importance and, therefore, the greater its potential economic value (Breitzman and Thomas 2002, Kapoor, Karvonen and Kässi 2013, OECD 2015, Omland 2011, Trajtenberg 1990).
Opposition/litigation. Opposition suits filed by competitors pose a risk to patent owners. However, they are, collectively, an indicator of the value of that patent (Olmand 2011) because competitors will not readily incur high legal costs to challenge a patent with little or no value (Hall, Jaffe and Trajtenberg 2005). Moreover, the strength of a patent can be measured by the number of opposition suits that it survives (Olmand 2011).
Brief Overview of Methodology
This research study is based on a survey of SPPPs and TPPs from Europe and the United States. The participants were restricted to those who work primarily in English to minimize language ambiguity.
Research Approach
To answer the research questions presented above, three groups of hypotheses were employed in this study:
H1. This hypothesis compares the willingness and motivations of SPPPs and TPPs for participating in noncore patent out-licensing strategies. Therefore:
H1o: The mean number of TPPs and their motivations for participating in non-core patent out-licensing activities is not the same as the mean number of SPPPs and their motivations.
To test H1, each variable will be analyzed individually, whereby:
H1ao refers to the mean number of respondents; and,
H1bo relates to motivations for participating in noncore patent out-licensing.
H2. This group of hypotheses evaluates the frequency that these skills are employed as part of daily functions. Therefore:
H2o: The mean frequency of business research events for TPPs is not the same as the mean frequency of business research events for SPPPs. To test this hypothesis, each variable will be analyzed individually. Hence:
H2ao refers to the mean frequency of patent portfolio reviews;
H2bo refers to the mean frequency of competitor intelligence analysis;
H2co refers to the mean frequency of market intelligence analysis;
H2do refers to the mean frequency of patent searches/ landscaping/mapping; and,
H2eo refers to the mean frequency of patent valuation analysis.
H3. This hypothesis evaluates the proficiency of SPPPs and TPPs at these business research skills by analyzing the proportion of each group that require further training in any of the business research skills. Therefore:
H3o: The proportion of TPPs requiring further training in any of the five business research skills is not the same as the proportion of SPPPs requiring further training in any of the five business research skills.
Basic Findings
Respondents. Forty-one SPPPs and 28 TPPs responded to the survey. Based on χ2 analyses, there is no statistical difference in the patent experience of the participating SPPPs and TPPs (χ2 = [5, N= 69] = 5.04, p > .05) and their patent licensing experience (χ2 = [4, N= 69] = 7.04, p > .05).
Analysis of H1
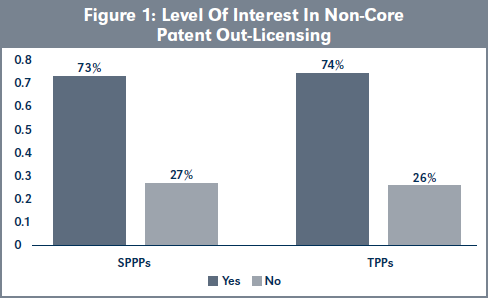
Evaluation of H1a. The analysis of responses by the participants shows no statistical difference in the level of interest in non-core patent out-licensing by SPPPs and TPPs (Figure 1; χ2 = [1, N= 53] = 0.002, p > .05), page 220.
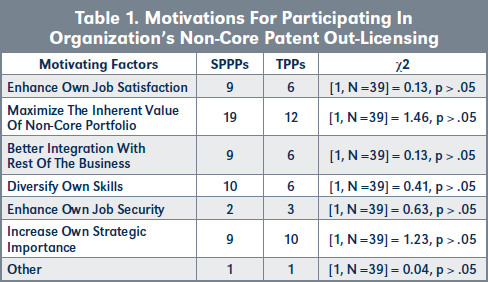
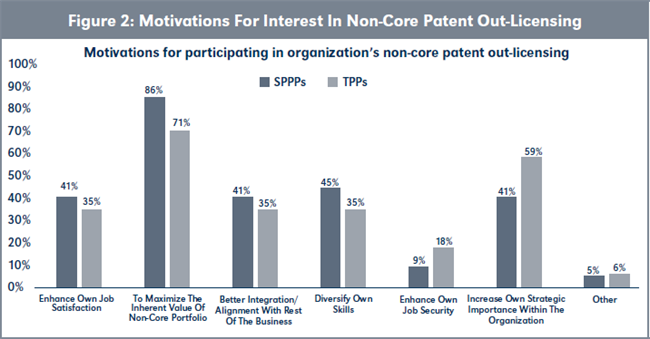
Evaluation of H1b. There is no statistical difference in the motivations of SPPPs and TPPs for wanting to participate in the non-core patent licensing activities of their organization (see Table 1 and Figure 2, page 220). However, more SPPPs are motivated by their desire to maximize the inherent value of their patent portfolios than TPPs, while more TPPs were motivated by increasing their own strategic importance to their organizations.
Conclusions to hypothesis H1. H1o is rejected in favor of the alternative hypothesis that: H1a: The mean number of TPPs and their motivations for participating in non-core patent out-licensing activities is the same as the mean number of SPPPs and their motivations.
Analysis of H2
The frequency with which the respondents employ the five business research activities as part of daily function was analyzed.
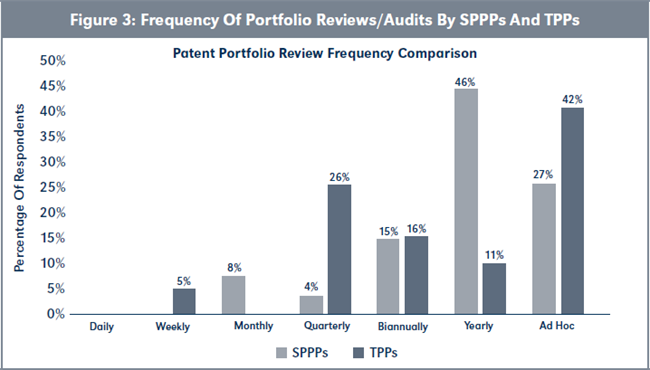
Evaluation of H2a. Figure 3, page 221, shows that TPPs, on average, conduct patent reviews/audits more frequently than the SPPPs, although this difference is not statistically significant (χ2 = [6, N= 45] = 12.23, p > .05).
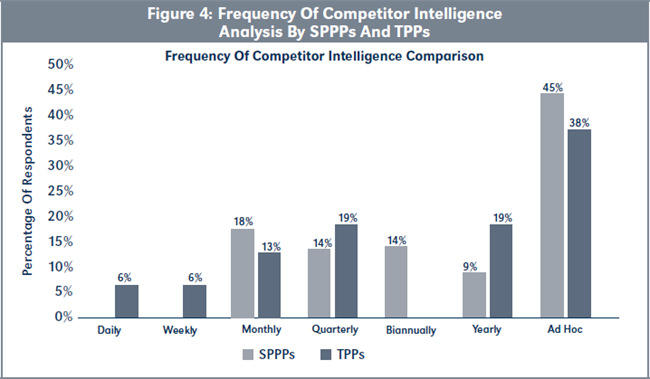
Evaluation of H2b. Figure 4, page 221, shows that TPPs, on average, conduct competitor intelligence analysis more frequently than SPPPs, but this difference is not statistically significant (χ2 = [6, N= 38] = 6.07, p > .05).
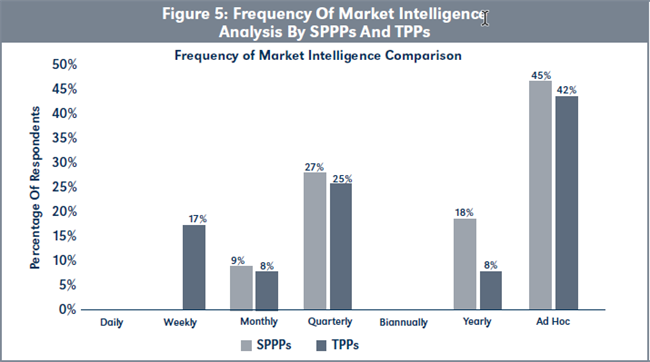
Evaluation of H2c. The data presented in Figure 5, page 222, shows that TPPs, on average, conduct market intelligence analysis more frequently than SPPPs although this difference is not statistically significant (χ2 = [6, N= 23] = 2.29, p > .05).
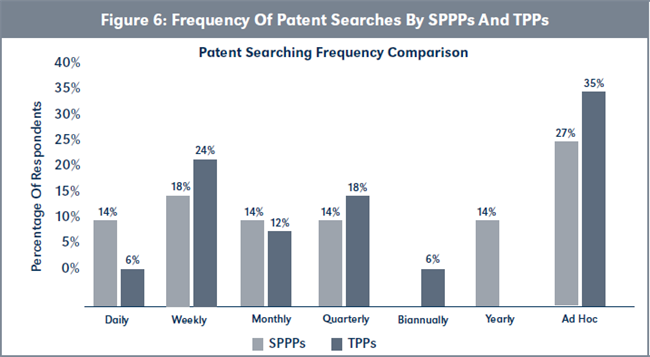
Evaluation of H2d: conducting patent searches/mapping/ landscaping. Figure 6, page 222, illustrates that TPPs, on average, conduct patent searches/mapping/ landscaping more frequently than SPPPs. However, this difference is not statistically significant (χ2 = [6, N= 39] = 5.22, p > .05).
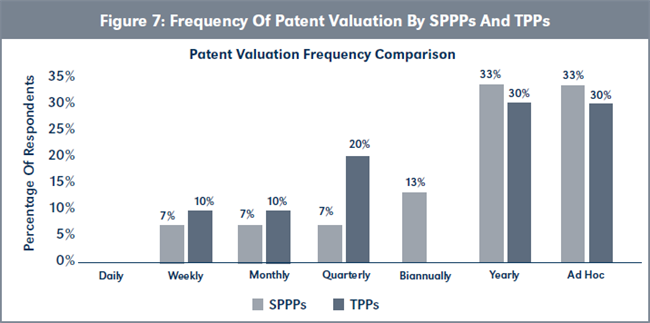
Evaluation of H2e. The data summarized in Figure 7, page 223, shows that TPPs conduct patent valuations more frequently than SPPPs, although mean difference in frequency is not statistically significant (χ2 = [6, N= 25] = 2.43, p > .05).
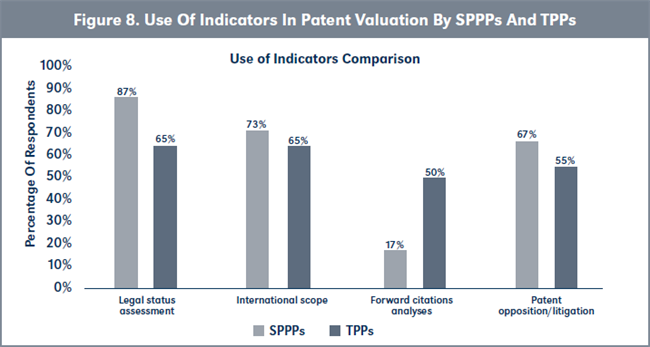
Due to the importance of patent valuation to successful non-core patent out-licensing, respondents were asked about the indicators they use in valuing patents. Their responses, which are summarized in Figure 8, page 223, show that SPPPs assess legal status more often than TPPs, while TPPs analyze forward citations more often than SPPPs. Furthermore, more TPPs analyze forward citation than SPPPs, statistically (see Table 2, page 223).

Conclusions to hypothesis H2. TPPs appear to be more proficient at these business research activities due to the high frequency with which they employ these skills as part of their daily function. Therefore: H2o is accepted.
H2o: The mean frequency of business research events for TPPs is not the same as the mean frequency of business research events for SPPPs.
Analysis of H3
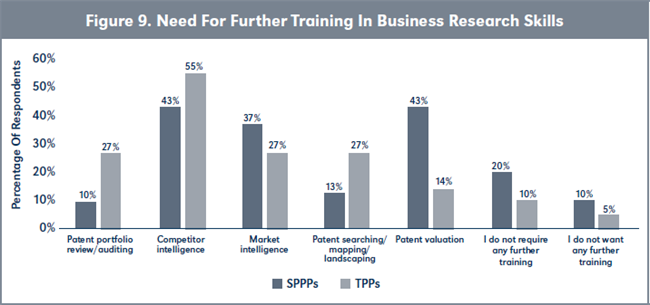
Evaluation of H3. More TPPs want further training in conducting competitor intelligence analysis compared to SPPPs, although the difference is not statistically significant (see Figure 9 and Table 3, page 224). However, more SPPPs wanted more training in conducting patent valuations than TPPs and the level of difference was statistically different. Furthermore, there are statistically more TPPs requiring no further training in any of the business research skills compared to SPPPs.

Conclusion to hypotheses H3. Based on the analyses of the responses, H3o is accepted. Therefore: H3o: The proportion of TPPs requiring further training in any of the five business research skills is not the same as the proportion of SPPPs requiring further training in any of the five business research skills.
Summary
The findings from this study show that despite the similarity in their patenting and patent licensing experience, SPPPs are proportionally less proficient at conducting business research compared with TPPs. The difference in proficiency may be attributed to the prevailing business models of the pharmaceutical industry and the technology industry, which are shaped by the threat of patent litigation and the impact of rapid evolution of technology (Bilir 2014, Lichtenthaler 2011). As such, there appears to be a greater tendency for technology companies to employ business research skills to hasten the out-licensing of non-core patents to recoup R&D investments and minimize litigation risks (Bilir 2014).
Increasing the levels of non-core patent out-licensing in Swiss pharmaceutical companies will require reversing the current perception of non-core patents as having little or no value (Knowles, et al. 2013). This could encourage the provision of more business research training to SPPPs to enable them to identify out-licensing opportunities for the non-core patent portfolios that they manage. The viability of this business strategy is encouraged by the high interest in noncore patent out-licensing by SPPPs due to their desire to maximize the inherent value of the patent portfolios that they manage (see Figures 1 and 2, page 220). It must be noted that these two factors do determine business research competence or frequency of noncore patent out-licensing.
These findings can be summarized in a business model (Figure 10) reiterating the effect of frequent performance of business research on business research competence which, in turn, facilitates more frequent non-core patent out-licensing as observed in the technology. The utility of this business model in patent-holding pharmaceutical companies around the world will be investigated in the following case study.

Case Study
A case study was initiated to validate the proposed business model (Figure 10) and test its suitability in patent-holding pharmaceutical companies outside of Switzerland. This study compares the same survey responses of SPPPs with U.S.-based pharmaceutical patent professionals (USPPPs) and TPPs. The USPPPs were selected from patent professionals working in biopharmaceutical companies based in the Boston/Cambridge and New York/New Jersey areas of the United States.
Choice of respondents for the case study. The U.S. was chosen because it is ranked first and second in the number of patent filings in the fields of computer and medical technologies, respectively (WIPO 2018). Furthermore, the Boston/Cambridge and New York/New Jersey areas are ranked numbers one and three for biopharmaceutical and medical device hubs in the US (Philippidis 2017). However, it should be noted that the Boston/Cambridge and New York/New Jersey areas represent a small fraction of the pharmaceutical industry of the United States
Basic findings. Ten USPPPs participated in the case study survey. Based on χ2 analyses, the USPPPs statistically have more patenting experience than the SPPPs (χ2 = [4, N= 51] = 26.86; p < .05), but there is no statistical difference between the patent licensing experience of the USPPPs and SPPPs (χ2 = [3, N= 51] = 2.76; p > .05).
Validation of H1
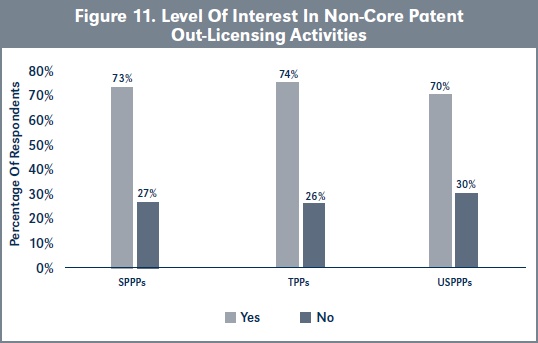
Validation of H1a. Results show that there is no difference in the level of interest in non-core patent out-licensing by USPPPs, SPPPs and TPPs (Figure 11; χ2 = [1, N= 63] = 0.057, p > .05).
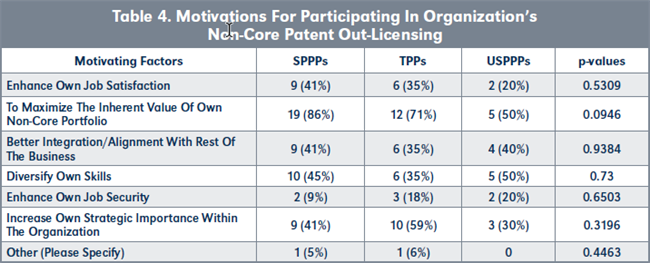
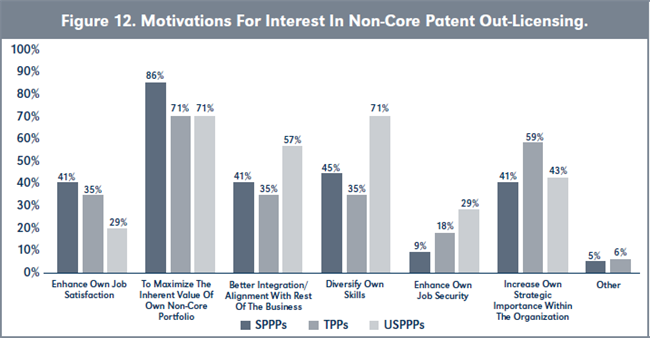
Evaluation of H1b. There is also no statistical difference in the motivations of USPPPs, SPPPs and TPPs wanting to participate in the non-core patent licensing activities of their organizations (see Table 4 and Figure 12, page 226). However, USPPPs are equally as motivated by a desire to diversify their own skills as they are motivated by maximizing the inherent value of their non-core patent portfolios.
Validation of H2
The findings from the statistical evaluation of hypotheses H2a to H2e were analyzed using an ANOVA test.
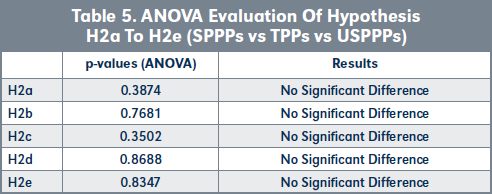
Evaluation of H2a. Data presented in Table 5, page 227, show that there is no statistical difference in the frequency that USPPPs, SPPPs and TPPs conduct patent reviews/ audits.
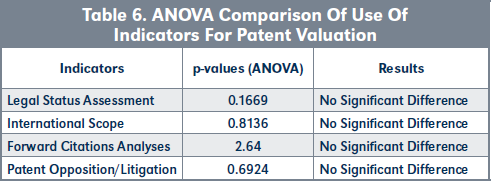
The indicators used by USPPPs, SPPPs and TPPs to value patents were also compared and are presented in Table 6, page 227.
Validation of H3
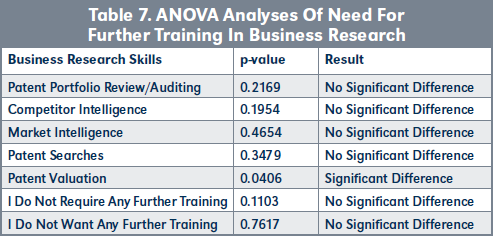
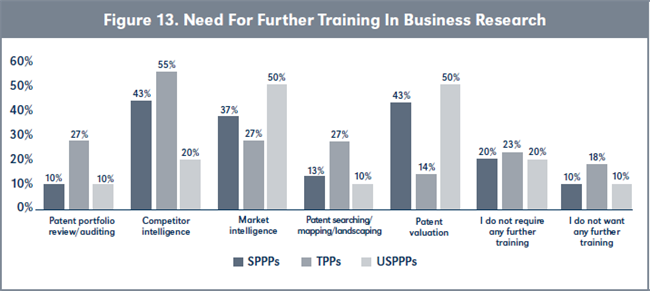
Evaluation of H3. Results presented in Table 7, page 227, show that there is a higher need for more training in patent valuations by SPPPs and USPPPs compared to TPPs (see Figure 13, page 228).
Conclusions to validating H1, H2, H3. The results presented above show that there is no difference in the level of interest or motivations for participating in the non-core patent out-licensing by USPPPs and SPPPs. Furthermore, the USPPPs and SPPPs are less competent at conducting business research compared to TPPs, and this is reflected by their higher need for further training in patent valuation (see Table 7, page 227).
Limitations of This Case Study
There are some limitations of this study that may undermine the findings from the study and the global applicability of the resulting business model from these findings. The small size of participants (38 SPPPs and 10 USPPPs) may not be representative of all patent professionals working in the pharmaceutical industry in Switzerland and the U.S. Another limitation of the study is that the survey of SPPPs was administered in English only, even though Switzerland is not a native English-speaking country. While the business of the patent departments of most Swiss-based pharmaceutical companies is conducted in English, proficiency in this language may vary among SPPPs.
Implication of the Findings
Despite these limitations, there is no statistical difference in the business research skills between SPPPs and USPPPs. This may also reflect the skills of pharmaceutical patent professionals around the world due to the global nature of most patent-holding pharmaceutical companies. However, this will require further investigation to verify this postulation.
Although the surveyed USPPPs represent a micro cosm of the U.S. pharmaceutical patent profession, it could be inferred that low levels of pharmaceutical non-core patent out-licensing in Switzerland, as found by the PATLICE report, may be the same as in the U.S. pharmaceutical industry, suggesting an over-reliance on core patents for licensing activities. However, this is an area for further research.
Despite this postulation, the findings from this study highlight the significant shortfall in the business research skills of SPPPs and USPPPs compared with those of TPPs. This may be due to the business model in operation in both industries. The higher levels of business research skills of TPPs may be attributed to the business culture of the technology industry, which is shaped by the threat of patent litigation and the rapid evolution of technology (Bilir 2014). Consequently, there is a greater urgency built into their business model to facilitate the rapid out-licensing of non-core patents to recoup R&D investments and avoid litigation suits; this requires the higher business research competence acquired by training and frequent deployment of these skills.
Therefore, Swiss and U.S. pharmaceutical companies should take advantage of the interest shown by SPPPs and USPPPs in non-core patent out-licensing activities and provide more business research training to facilitate higher levels of non-core patent licensing activities as illustrated in Figure 10.
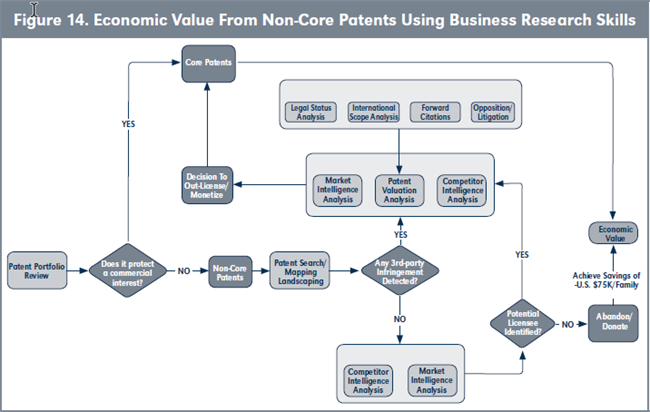
A workflow depicting how the application of business research skills can lead to the generation of economic value through leveraging non-core patents is presented in Figure 14, page 228.
Available at Social Science Research Network (SSRN): https://ssrn.com/abstract=3897879.
Works Cited
Radauer, Alfred, and Tobias Dudenbostel. 2013. PATLICE Survey: Survey on patent licensing activities by licensing firms. Directorate-General for Research and Innovation, European Commission, Luxembourg: Publications Office of the European Union, 108.
Berndt, Ernst R., Deanna Nass, Michael Kleinrock, and Murray Aitken. 2015. “Decline In Economic Returns From New Drugs Raises Questions About Sustaining Innovations.” Health Affairs 34 (2): 245-252.
Chen, Zhenmin, and Fang Zhao. 2010. “Determining minimum survey sample size for multi-cell case.” International Journal of Reliability, Quality & Safety Engineering 17 (6): 579-586.
Chesbrough, Henry, and Eric L. Chen. 2013. “Recovering Abandoned Compounds Through Expanded External IP Licensing.” California Management Review 55 (4): 83-101.
Song, Chie Hoon, and Jeung-Whan Han. 2016. “Patent cliff and strategic switch: exploring strategic design possibilities in the pharmaceutical industry.” SpringerPlus 5 (1): 692.
Grass, Michael, and Samuel Mösle. 2015. The Importance of the Pharmaceutical Industry for Switzerland. Basel: Interpharma, 64.
Danzon, Patricia M., Andrew Epstein, and Sean Nicholson. 2007. “Mergers and Acquisitions in the Pharmaceutical and Biotech Industries.” Managerial and Decision Economics (Wiley) 28 (4/5): 307-328.
Demirbag, Mehmet, Chang-Keong Ng, and Ekrem Tatoglu. 2007. “Performance of Mergers and Acquisitions in the Pharmaceutical Industry: A Comparative Perspective.” Multinational Business Review 15 (2): 41-62.
Josselyn, Sara. 2015. M&A activity in the pharmaceutical sector is driving the commercialization of new drugs. August 19. Accessed September 16, 2016. https://www.deallawwire.com/2015/08/19/ma-activity- in-the-pharmaceutical-sector-is-driving-the-commercialization- of-new-drugs/.
Kirchhoff, Marc, and Dirk Schiereck. 2011. “Determinants of M&A Success in the Pharmaceutical and Biotechnological Industry.” IUP Journal of Business Strategy 8 (1): 25-50.
Mousavi, Nader A. 2011. “The evolving role of intellectual property in M&A transactions.” Intellectual Asset Management (IP Media Group) (48): 28-34.
Aoki, Reiko, and Aaron Schiff. 2008. “Promoting access to intellectual property: patent pools, copyright collectives, and clearinghouses.” R&D Management 38 (2): 189-204.
Hunter, Jackie, and Susie Stephens. 2010. “Is open innovation the way forward for big pharma?” Nature Reviews Drug Discovery 9 (2): 87-88.
Jeitschko, Thomas D., and Nanyun Zhang. 2014. “Adverse Effects of Patent Pooling on Product Development and Commercialization.” B.E. Journal of Theoretical Economics 14 (1): 31.
Lee, Peter. 2012. “Transcending the Tacit Dimension: Patents, Relationships, and Organizational Integration in Technology Transfer.” California Law Review 100 (6): 1503-1572.
Rodriguez, Victor. 2010. “Patent Pools: Intellectual Property Rights and Competition.” The Open AIDS Journal 4: 62-622.
Moss, Grant. 2015. “Outsourcing IP monetisation.” Intellectual Asset Management Yearbook (iam) 8-13. http://www.iam-media.com/Intelligence/IAM-Yearbook/ 2015/Monetisation-and-strategy/Outsourcing- IP-monetisation.
Goldheim, David, Gene Slowinski, Joseph Daniele, Edward Hummel, and John Tao. 2005. “Extracting Value from Intellectual Assets.” Research Technology Management 48 (2): 43-48.
Hubbard, Marc, and Jennifer Brooks. 2010. “The Effect of Seagate on Patent Infringement Risk Management Strategies.” Intellectual Property & Technology Law Journal 22 (3): 1-4.
Carson, Ron. 2008. “Get your assets in gear: aligning IP strategy and business strategy.” World Intellectual Property Organization. Accessed January 8, 2018. http://www.wipo.int/export/sites/www/sme/en/documents/ pdf/ip_business_strategy.pdf.
Chan, Judy. 2007. “Developing an IP licensing strategy in China.” Licensing in the Boardroom (A supplement to Intellectual Asset Management magazine) (www.iam-magazine.com) 46-49.
Gollin, Michael A. 2011. “Monetizing Intellectual Property To Improve Financial Performance.” Venable LLP. November 14. Accessed December 4, 2017. https://www.venable.com/monetizing-intellectual-property- to-improve-financial-performance-11-14-2011/.
Gwinnell, Harry J., and Katherine S. Boyle. 2014. “Ascending the Intellectual Property Management Pyramid.” Cybaris 5 (1 (Article 7)): 121-148.
O’Haver, Russ R. 2003. “Management Intangibles: Capitalizing on Your IP Assets.” Journal of Internet Law 7 (16-21).
Rivette, Kevin G., and David Kline. 2000. “Discovering New Value in Intellectual Property.” Harvard Business Review 78 (1): 54-66.
Bader, Martin A., Oliver Gassmann, Nicole Ziegler, and Frauke Ruether. 2012. “Getting the most out of your IP—patent management along its life cycle.” Drug Discovery Today (Elsevier) 17 (7-8): 281-284.
Sullivan, Patrick, and Suzanne Harrison. 2008. “IP and Business: Managing IP as a Set of Business Assets.” World Intellectual Property Organization. February. Accessed June 20, 2017. http://www.wipo.int/ wipo_magazine/en/2008/01/article_0008.html.
European Patent Office. 2017. Unlocking untapped value: EPO SME case studies on IP strategy and IP management. Case Study, Munich: European Patent Office, 76.
Hadzima Jr, Joseph G. 2015. “You need a business intelligence process, not a technology landscape.” Intellectual Asset Management magazine (69).
Kaplan, Robert S., and David S. Norton. 2004. “The strategy map: guide to aligning intangible assets.” Strategy & Leadership 32 (5): 10-17. doi:https://doi. org/10.1108/10878570410699825.
Lichtenthaler, Ulrich. 2011. “The evolution of technology licensing management: identifying five strategic approaches.” R&D Management 41 (2): 173-189.
Simpson, Alistar G., and Martin Langloi. 1998. “Potential Patent Profits.” CMA–the Management Accounting Magazine 72 (7): 30-32.
Vuori, Vilma. 2009. “Linking Business and Competitive Intelligence with Intellectual Capital—How Could BCI Contribute to ICM?” Proceedings of the European Conference on Intellectual Capital 514-523.
Saracho, Ana I. 2005. “The Relationship between Patent Licensing and Competitive Behavior.” The Manchester School 73 (5): 563-581.
Grézes, Vincent. 2015. “The Definition of Competitive Intelligence Needs through a Synthesis Model.” Journal of Intelligence Studies in Business 5 (1): 40-56.
McGonagle, John J., and Carolyn M. Vella. 2012. “What is Competitive Intelligence and Why Should You Care About it?” In Proactive Intelligence, 9-19. London: Springer-Verlag London.
Goldheim, David, Gene Slowinski, Joseph Daniele, Edward Hummel, and John Tao. 2005. “Extracting Value from Intellectual Assets.” Research Technology Management 48 (2): 43-48.
Knowles, Sherry M., Adrian Dawkes, Bill Geary, Brent Bellows, and Karl Normington. 2013. “Monetisation models in biotech and pharma.” Intellectual Asset Management (www.iam-magazine.com) 26-37.
McGavock, Daniel M., and Michael C. Newell. 2007. “Five critical questions your CFO should be asking about IP.” Intellectual Asset Management 76-80.
Cantrell, Robert. 1996. “Patent Intelligence - Information to Compete Before Products Are Launched.” Competitive Intelligence Review 7 (1): 65.
Salvador, Marisela Rodríguez, and Mario Alberto Tello Bañuelos. 2012. “Applying patent analysis with Competitive technical intelligence: the case of Plastics.” Journal of Intelligence Studies in Business 2 (1): 51-58.
Nelke, Margareta, and Charlotte Håkansson. 2015. “The Role of the Information Professional in Competitive Intelligence.” In Competitive Intelligence for Information Professionals, by Margareta Nelke and Charlotte Håkansson, 73-80. Oxford: Chandos Publishing.
Pargaonkar, Yateen R. 2016. “Leveraging patent landscape analysis and IP competitive intelligence for competitive advantage.” World Patent Information 45: 10-20.
Wirtz, Harald. 2012. “Valuation of Intellectual Property: A Review of Approaches and Methods.” International Journal of Business and Management 7 (9): 40- 48. doi:10.5539/ijbm.v7n9p40.
Hu, Yuanjia, Ying Bian, and Yitao Wang. 2008. “Opening the Black Box of Pharmaceutical Patent Value: An Empirical Analysis.” Therapeutic Innovation and Regulatory Science 42 (6): 561-568.
Olmand, Nils. 2011. “Valuing patents through indicators.” In The Economic Valuation of Patents: Methods and Applications., by Federico Munari and Raffaele Oriani, edited by Federico Munari and Raffaele Oriani, 392. Chelmsford: Edward Elgar Publishing.
Grimaldi, Michele, Livio Cricelli, and Francesco Rogo. 2018. “Valuating and analyzing the patent portfolio: the patent portfolio value index.” European Journal of Innovation Management 21 (2): 174-205.
OECD. 2015. Measuring the Technological and Economic Value of Patents. OECD, OECD.org, 85-126.
European Commission. 2006. “Study on evaluating the knowledge economy what are patents actually worth? The value of patents for today’s economy and society.” EC.EUROPA.EU. July 23. Accessed June 14, 2018. http://ec.europa.eu/internal_market/indprop/ docs/patent/studies/patentstudy-report_en.pdf.
Kapoor, Rahul, Matti Karvonen, and Tuomo Kässi. 2013. “Patent value indicators as proxy for commercial value.” International Journal of Intellectual Property Management 6 (3): 217-232.
Breitzman, Anthony, and Patrick Thomas. 2002. “Using patent citation analysis to target/value M&A candidates.” Research-Technology Management 45 (5): 28-36.
Omland, Nils. 2011. “Valuing Patents through Indicators.” In The Economic Valuation of Patents., by Federico Munari and Raffaele Oriani, 169-201. Cheltenham: Edward Elgar Publishing.
Trajtenberg, Manuel. 1990. “A Penny for Your Quotes: Patent Citations and the Value of Innovations.” RAND Journal of Economics 21 (1): 172-187.
Hall, Bronwyn H., Adam Jaffe, and Manuel Trajtenberg. 2005. “Market Value and Patent Citations.” The RAND Journal of Economics 36 (1): 16-38.
Bilir, L. Kamran. 2014. “Patent Laws, Product Life-Cycle Lengths, and Multinational Activity.” The American Economic Review 104 (7): 1979-2013.
WIPO. 2018. Facts and Figures 2017. March. http://www.wipo.int/edocs/infogdocs/en/ipfactsandfigures2017/.
Philippidis, Alex. 2017. Top 10 U.S. Biopharma Clusters. June 5. Accessed January 22, 2019. https://www. genengnews.com/a-lists/top-10-u-s-biopharma-clusters-5/.